Cost Per Lead on Social Media: From Post to Store Visit
You post across your networks, you see likes and comments, but you always come back to the real question: does this actually bring me customers? And crucially: how much does each customer cost to acquire?
That’s cost per lead (CPL)—the metric that transforms social media activity into real commercial leverage.
For a franchise network, it’s more complex: your customers follow a digital path before walking into a store. How do you trace that journey?
This article gives you the formulas, benchmarks, and most importantly the levers to lower your CPL.
The Franchise Funnel: From Social Post to Store Visit
Before calculating CPL, understand the real customer journey.
The Funnel Steps
- Impression — Someone sees your post in their feed
- Engagement — They like, comment, or share
- Click — They click the post or your link
- Landing — They reach your site or Google Business Profile
- Local action — They click “directions” or “call”
- Store visit — They physically show up
- Purchase/Conversion — They buy or commit
Real Conversion Rates by Step (Retail/Beauty)
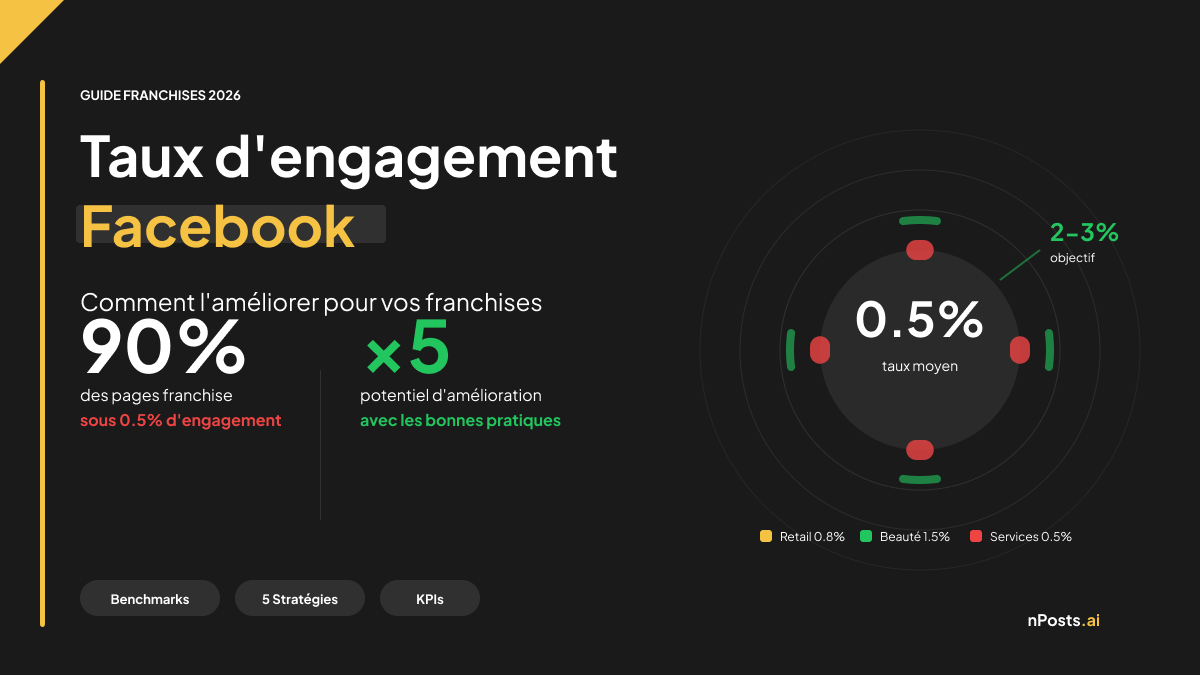
These engagement rates align with the 2026 benchmarks by platform and sector we compiled from Hootsuite, Buffer, and Sprout Social data.
| Step | Average Rate | Example: 10K impressions |
|---|---|---|
| Impression → Engagement | 2.8% | 280 interactions |
| Engagement → Click | 15% | 42 clicks |
| Click → Landing | 95% | 40 visits |
| Landing → Local action | 22% | 9 direction requests/calls |
| Local action → Store visit | 45% | 4 visits |
| Visit → Purchase | 68% | 3 customers |
Global conversion rate: 10,000 impressions → 3 customers = 0.03%
This explains why high volumes matter for franchises.
The Multi-Touch Attribution Trap
Here’s the real challenge: how do you know that store visit came from last week’s Instagram post?
Someone could:
- See your post Thursday
- Check product price Saturday
- Read a review Saturday
- Call the store Monday
- Visit Wednesday
4 days and 4 touchpoints later, you lose the trail.
For franchises this is critical. Your potential customer is hyper-local: you need to trace from social post to store visit.
CPL by Platform: Facebook, Instagram, TikTok, LinkedIn
Here are average cost per lead figures observed in 2026 for franchise networks (Meta, Hootsuite, Sprout Social):
Paid CPL (Advertising)
| Platform | Average CPL | Range | Best For |
|---|---|---|---|
| €25–60 | €15–120 | B2B, luxury sectors | |
| Instagram/Facebook | €10–25 | €5–50 | Retail, food, beauty |
| TikTok | €12–30 | €8–60 | Youth sectors (fitness) |
| YouTube | €18–40 | €10–80 | Long-form content |
Sources: Meta Ads Benchmark 2026 (Q1–Q2), Sprout Social CPL Report.
Factors that lower or raise CPL:
- Geo targeting: “5 km around the store” vs “entire region” = -30% to -50% CPL
- Custom audiences: Retargeting existing audience = CPL -40%
- Creative quality: Native video = CPL -25% vs static image
- Day parting: Publishing at peak hours = CPL -15%
Paid vs Organic ROI
Paid: Direct spend. For a complete ROI framework including organic, paid, and global variants, see our franchise social media ROI guide.
- Investment: €1,000 LinkedIn ads
- Leads generated: 25 leads
- CPL: €40
- Average customer value: €150
- ROI: 150/40 = 3.75x
Organic: Time investment.
- Creation time: 10h/month
- Hourly rate: €50/h → €500/month
- Leads generated: 8 leads/month
- CPL: €500/8 = €62.50
- Average customer value: €150
- ROI: 150/62.50 = 2.4x
Verdict: Paid has better ROI if optimized. But a poorly-run paid campaign (€80 CPL for a €50 lead) loses money.
Retargeting Cross-Platform (The Hidden Lever)
Retargeting delivers 3.5× more ROI than cold prospecting. Why? Someone who saw your post, clicked but didn’t convert is a warm lead. A retargeting ad brings them back to mind.
| Scenario | CPL | ROI |
|---|---|---|
| Cold prospecting | €40 | 3.75x |
| 7-day retargeting (site visitors) | €12 | 12.5x |
| 14-day retargeting (engagers) | €8 | 18.75x |
Implication: Allocate 70% of paid budget to retargeting, 30% to cold prospecting.
Calculate Your Real CPL (Formula + Example)
Simple Formula
CPL = (Monthly ad budget + Tools + Labor) / Leads generated

Labor = Content creation and community management costs
Example: 50-Store Retail Network
Scenario 1: Paid Only (Facebook Ads)
| Item | Cost |
|---|---|
| Facebook ad budget | €8,000 |
| Scheduling tool (Buffer/Hootsuite) | €150 |
| Community management: 0.5 person-days/week | €800 |
| Total monthly | €8,950 |
Measured results:
- Impressions: 250K
- Clicks to GBP/landing: 800
- Store visits: 180
- Converted leads (purchase): 142
CPL = €8,950 / 142 = €63 Average customer value: €180 ROI: 180 / 63 = 2.85x
Scenario 2: Hybrid (Organic + Paid)
| Item | Cost |
|---|---|
| Facebook ad budget (reduced) | €3,500 |
| Scheduling + analytics tools | €300 |
| Community management: 1.5 people | €2,400 |
| Total monthly | €6,200 |
Measured results:
- Organic posts/month: 150 (3/day × 50 stores)
- Organic impressions: 120K
- Ad impressions: 150K
- Total impressions: 270K
- Converted leads: 180
CPL = €6,200 / 180 = €34.44 Average customer value: €180 ROI: 180 / 34.44 = 5.2x
Conclusion: The hybrid approach is more efficient. It requires more work (1.5 people vs 0.5), but CPL cuts in half.
Reference Benchmark for Networks
To position yourself quickly:
| Sector | Organic | Hybrid | Paid Only |
|---|---|---|---|
| Retail | €55 | €28 | €45 |
| Real estate | €80 | €40 | €60 |
| Food | €45 | €22 | €35 |
| Beauty | €50 | €25 | €42 |
| Fitness | €40 | €20 | €38 |
If your CPL exceeds these thresholds, you have a leak. Poor targeting, weak content, or misconfigured attribution.
Organic vs Paid: When Paying Actually Makes Sense
The Real Organic Cost Formula
Many think: “Organic posts are free!”
Wrong.
Here’s reality:
Organic CPL = (Content creation time × Hourly rate) / Leads
Example:
- You create 20 posts/month
- 30 min per post = 10 hours
- Hourly rate = €50/h
- Implicit cost = 10 × 50 = €500
- Leads generated: 8
- Real CPL = €500 / 8 = €62.50
More realistic, right?
When to Invest in Paid
Invest in paid ads if:
- Your organic CPL > €40
- Your team lacks creative capacity
- You have a precise target audience (geography, interests)
- You have a seasonal product/service (urgent lead generation)
Stick with organic if:
- Your organic CPL < €25 (you’re crushing benchmarks)
- You have creative time available
- Your sector isn’t hyper-competitive
Recommended Hybrid Approach (70% Organic / 30% Paid)
The balanced strategy for franchises. For a full budget allocation breakdown by network size, see our dedicated guide.
Months 1–2: Organic only
- Generate 50–100 foundational posts at HQ
- Measure CPL = (time × rate) / leads
- Identify your top performers
Months 3+: Hybrid
- Take your 3–5 best organic posts
- Boost them with 30% of ad budget
- Keep 70% content organic
- Average CPL should be 40–50% cheaper than paid-only
5 Levers to Lower Your CPL
1. Ultra-Local Geographic Targeting
Main lever: Replace “Region” with “5 km around each store.”
Impact: -30% to -50% CPL
How:
- Create one ad audience per store (5 km radius)
- Test 10 km if needed
- Use lookalike audiences (existing customers → similar prospects)
Example: Instead of “Women 30–45 in Paris,” target “Women 30–45 within 10 km of the Paris Montmartre store.”
2. Amplify Best Organic Content with Ads
Lever: Organic is your testing ground before scaling.
Process:
- Publish 20 organic posts/month
- Wait 7–14 days
- Identify 2–3 posts with best engagement
- Boost them with €100–200 in ads
Impact: Pre-validated posts convert 40–60% better in ads.
3. Cross-Platform Retargeting
Lever: Everyone who clicked or visited is a warm lead.
How:
- Install Facebook/TikTok pixel on site
- Install pixel on Google Business Profile
- Create “7-day visitor” audiences
- Retargeting budget: 2× prospecting budget
Impact: CPL -60% to -70%
4. Lookalike Audiences Per Store
Lever: Use current customers as your “model” to find similar people.
How:
- Upload anonymized customer list to Meta
- Meta creates lookalike audience
- Target this audience + geographic radius
Impact: -25% CPL + better lead quality
5. Short-Form Video + Storytelling
Lever: Native videos convert better than images.
Benchmark:
- Static image: CPL €40
- Carousel: CPL €32
- Video < 60s: CPL €18
How:
- Generate 1–2 short videos per week from HQ
- Distribute to all franchisees
- Test formats: tutorials, behind-the-scenes, challenges, testimonials
Impact: -55% CPL vs static image
Mistakes That Cost €5–20 Per Lead
80% of networks make these. Here are the hidden leaks:
Mistake 1: Ad Budget Without Retargeting
You spend €5,000 on cold prospecting, €0 on retargeting.
100 people see the ad, 15 click, 3 visit landing → 2 don’t convert. These 2? Forgotten. One retargeting 3 days later = 40% come back.
Fix:
- 60% retargeting budget (€3,500)
- 40% cold prospecting (€2,500)
Impact: CPL -30% vs all prospecting.
Mistake 2: Geo-Targeting Too Broad
You target “Region” instead of “5 km around each store.”
Someone 50 km from your store sees the ad. Click cost = the same. Conversion odds = -70%.
Fix:
- Create one ad audience per store
- Targeting: 5 km minimum, 15 km maximum
- Lookalike: from store customers, not the region
Impact: CPL -40% + more qualified leads.
Mistake 3: Attribution Misconfigured (Undercounting Leads)
You count “online conversions” only. You miss people who visit the store after seeing a post.
You publish video Thursday. Someone sees it, visits the store Saturday, buys Tuesday. You say: “No lead from that video.” Reality: you have 1, but didn’t count it.
Result: Your CPL looks 3× more expensive than it actually is.
Fix:
- Unique promo code per store (STORE101, STORE102)
- UTM parameters + conversion pixel
- Phone call: “How did you find us?”
Impact: You finally understand true lead sources.
Mistake 4: Static Content Boosted with Ads
You take a static product photo and boost with €200. CPL: €45.
Test a Reel (15s video) with same budget → CPL: €14.
Fix: Always test format organically before boosting. Native videos perform 2–3× better.
Impact: CPL -60% by switching format.
Mistake 5: Forget Volume
You post 2/week at HQ, distribute to 50 stores = 100 posts/week. You expect leads.
100 posts → 2,000–3,000 impressions/day = insufficient. Benchmark: 8,000–15,000 impressions/month per store to generate 5–10 leads/month.
Fix: Post minimum 20–25/week at HQ (distributed to all stores).
Impact: Volume → consistent leads → better overall CPL.
Multi-Touch Attribution: Tracing the Online-to-Store Path
Here’s how to set up tracking to know where leads really come from.
1. UTM Parameters (The Foundation)
Every link = unique UTM per store:
https://yoursite.com/contact?utm_source=instagram&utm_medium=post&utm_campaign=april_2026&utm_content=store_101
Key elements:
- utm_source = instagram, facebook, tiktok
- utm_medium = post, ads, story
- utm_campaign = month + year
- utm_content = store ID (store_101, store_paris_montmartre)
nPosts.ai generates these automatically per store. Otherwise use UTM.io in bulk.
2. Unique Promo Codes Per Store
Give each location a unique code:
- Paris Montmartre store: MONT25
- Paris Marais store: MARAIS25
- Versailles store: VER25
When someone uses the code, you know the source.
3. Google Store Visits
For local searches, Google offers a native metric: Store Visits (directions + call clicks). Make sure your profiles are optimized first with our Google Business Profile franchise audit checklist.
Enable it:
- Verify all Google Business Profiles
- Link them to Google Analytics 4
- Track “Store Visits by Source”
Limitation: You see “Google Search” or “Google Maps,” not “Instagram.” That’s why UTM matters.
4. Unique QR Codes
Each post can include a unique QR per store:
- QR → landing page specific to that store
- Landing page tagged with UTM
- You know who scanned which store’s code
5. Facebook Pixel + Conversion API
Install Meta’s Conversion API on your site. When someone purchases, Meta knows it was from their ad.
Impact: Much more accurate attribution tracking.
Complete Framework: From Spend to ROI
Here’s how to structure your monthly tracking. For the 10 KPIs every franchise network should monitor, including formulas and tracking frequency, see our dedicated guide.
Tracking Dashboard (Google Sheets or Notion)
| Platform | Budget | Impressions | Clicks | Store Visits | Converted Leads | CPL | ROI |
|---|---|---|---|---|---|---|---|
| €4,000 | 120K | 400 | 90 | 61 | €65 | 2.77x | |
| €2,500 | 85K | 340 | 76 | 52 | €48 | 3.75x | |
| Organic | €1,500 | 40K | 150 | 34 | 23 | €65 | 2.77x |
| Total | €8,000 | 245K | 890 | 200 | 136 | €59 | 3.05x |
Goal: Reduce CPL from €59 → €45 in 3 months (via targeting + video optimization).
Real Cases: How 4 Networks Actually Optimized Their CPL
Case 1: Beauty Network (20 Salons) — Pure Organic, Zero Attribution
Starting situation:
- Social budget: €500/month (labor only, 0.5 person-days/week)
- Posts: 12/week at HQ, 40% of franchisees republish
- Calculated CPL: €500 / 8 leads = €62.50
- Hidden problem: Zero tracking. “We don’t really know where customers come from.”
Diagnosis:
- Attribution: Non-existent. No UTM, no codes, no pixels.
- Volume: Too low. 12 posts/week at HQ = 5,000 impressions per salon/month.
- Content: 80% static, 20% video. Videos perform 3× better.
What they did (Months 1–4):
- Tracking: Unique code per salon (BEAUT01, BEAUT02, etc.). Receptionist training.
- Content: Increase videos (before/after coloring, tutorials) from 20% → 40%.
- Volume: 12 → 20 posts/week at HQ.
Results (After 3 months):
- Real CPL discovered: €62.50 → €48 (after correcting attribution)
- Optimized CPL: €48 → €28 (via video + volume)
- Leads/month: 8 → 22 leads
Takeaway: First action = tracking. You can’t optimize what you don’t measure.
Case 2: Food Network (32 Restaurants) — Paid Ads, Bad Targeting
Starting situation:
- Monthly budget: €15,000 (€8,000 ads + €7,000 labor)
- CPL: €72
- Problem: “We spend 15K but only get 200 leads/month. Too expensive.”
Diagnosis:
- Ad targeting: “Paris region” = too broad. 40% of clicks from people 30+ km away.
- Audience: Cold only. €0 retargeting.
- Creative: 70% static images, 30% videos.
- Attribution: Partial. Online conversions only, no store visits.
What they did (Months 1–3):
- Targeting: Replace “Region” with “5 km around each restaurant.” €300/restaurant/month budget.
- Audience split: 60% retargeting (site visitors, engagers), 40% cold (lookalike + geo).
- Creative: Pivot to short video. 40% → 70% of budget.
- Attribution: Add Google Store Visits + unique UTM per restaurant.
Results (After 2 months):
- Gross CPL: €72 → €52
- Real CPL (including unmeasured store visits): €52 → €29
- Retargeting ROAS: 2.1x → 7.8x
- Leads/month: 200 → 385 leads
Takeaway: Bad targeting + wrong audience split = CPL 2× higher than optimal. Geo-targeting = priority #1.
Case 3: Retail Network (Optical, 45 Stores) — Hybrid, Progressive Optimization
Starting situation:
- Budget: €10,000/month (€4,000 ads + €6,000 labor)
- CPL: €42
- Franchisee publishing rate: 30%
- Goal: CPL €25 + 70% publishing rate
Diagnosis:
- Content: Good (45% video). No carousels.
- Volume: Acceptable (15 posts/week).
- Audience: Retargeting at 35% (should be 60%).
- Friction for franchisees: Posts need local adaptation. Many skip.
What they did (Months 1–6):
- Creative diversification: Add 5 carousels/month (before/after try-on, glasses-buying guides).
- Audience reallocation: 35% → 60% retargeting budget.
- Friction reduction: Ready-to-publish text, not “adapt-it.” Publishing rate → 68%.
- Volume: 15 → 18 posts/week.
Results (After 5 months):
- CPL: €42 → €28
- Publishing rate: 30% → 67%
- Leads/month: 238 → 357
- Active franchisees: 13/45 → 34/45
Takeaway: Optimization is iterative. -€2 CPL/month via testing. Reducing friction > increasing volume.
Case 4: Real Estate Network (18 Agencies) — Dual Funnel, Mixed Attribution
Starting situation:
- Budget: €12,000/month (€6,000 ads + €6,000 labor)
- CPL (clients): €68
- Hidden issue: 2 different funnels. Sellers (90+ day cycle). Buyers (7–30 day cycle).
Diagnosis:
- Attribution: Merged. No buyer/seller distinction.
- Creative: Identical for both funnels. Major mistake.
- Audience: Combined. Should be segmented by intent.
What they did (Months 1–4):
- Audience segmentation:
- “Selling” campaign (keywords “Sell house,” “Valuation,” 90+ day cycle)
- “Buying” campaign (keywords “Buy 3-bed,” “Real estate,” 15-day cycle)
- Distinct creative:
- Selling = testimonials + value (free appraisal)
- Buying = listings + speed
- Dual attribution:
- Seller = qualified lead = 1 agency call
- Buyer = basic contact = 0.3 agency call (+ mass email)
- Budget allocation: 40% selling (less volume, better value), 60% buying.
Results (After 3 months):
- CPL (sellers): €68 → €45 (better quality)
- CPL (buyers): €68 → €25 (high volume)
- Average CPL: €68 → €32
- Average seller value: +€180 vs buyer
Takeaway: Sometimes CPL alone isn’t enough. LTV, cycle time, and “cost per actual sale” matter more.
Final Benchmark: Where You Should Be
Here’s the “right place” by sector and maturity:
| Sector | New (0–6 months) | Established (6–18 months) | Optimized (18+ months) |
|---|---|---|---|
| Retail | €70–80 | €40–50 | €20–30 |
| Real estate | €90–100 | €50–65 | €30–40 |
| Food | €55–65 | €30–40 | €15–25 |
| Beauty | €60–70 | €35–45 | €20–30 |
| Fitness | €50–60 | €30–40 | €15–25 |
If you’re “New” and your CPL is 2× these figures, you have an attribution or targeting problem.
If you’re “Established” and progressing slowly toward “Optimized,” that’s normal. The last 30% comes from fine-tuning: format, day-parting, audience segmentation.
The Final Question: What Is a Social-Acquired Lead Really Worth?
This article gave you the technical numbers. But the reality:
- A customer acquired via social = long-term loyalty? Regular returns? Word-of-mouth?
- A customer acquired via email/affiliate = colder lead, less engaged?
CPL is a metric. LTV (Customer Lifetime Value) is the real goal.
Always measure both.
You have 50, 100, or 200 franchisees with no visibility on their social performance? Discover how nPosts.ai centralizes your social management. Optimized CPL = publishing rate 15% → 80%, quality content, per-store measurement.