You run marketing for a network with 50, 100, or 300 locations. Your franchisees are finally posting on social. But you’re blind. Which location is actually managing social? Which one stopped posting a month ago? What content actually works in-store?
I looked for this at Afflelou. Hootsuite, Buffer, Sprout Social—none of them answer. Those tools show by account (each location isolated). Not by network.
What you need is a dashboard built for franchisors. If you manage social media across multiple franchise locations, this is the reporting layer you are missing.
Why Buffer or Sprout Social Aren’t Enough
Standard tools manage by account. You need a view by network.
Here’s what you need but don’t have:
- Head office view: all locations aggregated at a glance
- Ranking: which location is winning, which is stalling
- Automated alerts: location inactive for 14 days (you know instantly)
- Geographic comparison: Southwest outperforms, North is stalling
- Performance by platform: how does Facebook stack up vs. Instagram and TikTok
Current reality: 85% of franchisees publish at least once per month (nPosts.ai study 2025, 500+ networks). But you at HQ don’t know. No dashboard. No central view. Just hope.
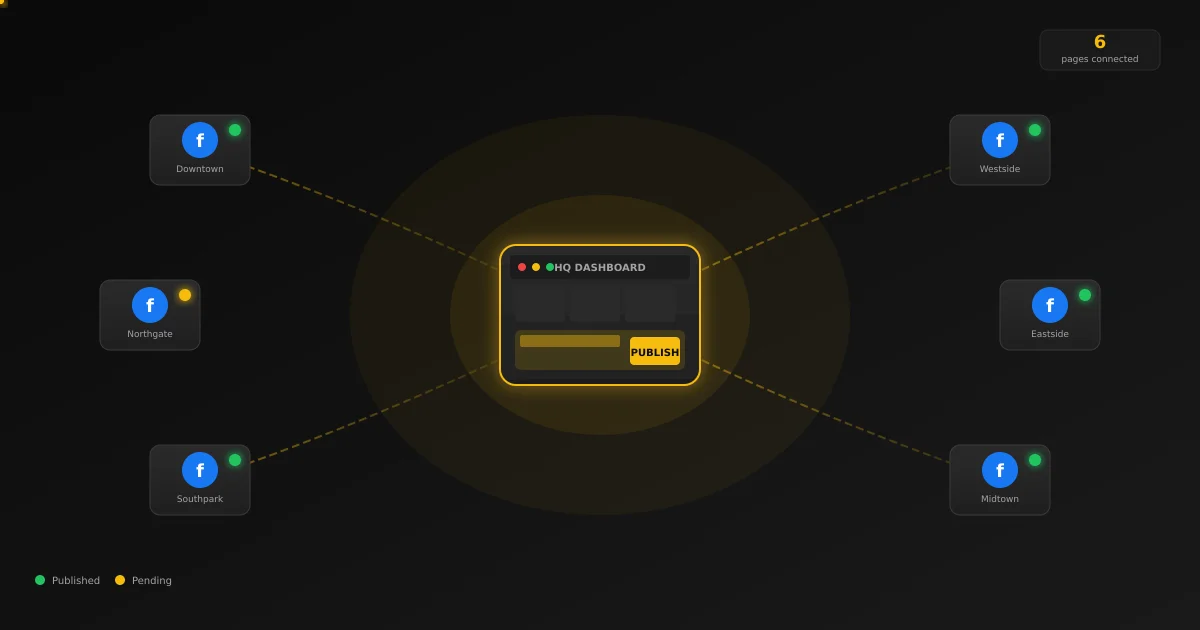
A franchise-first dashboard changes that. You see everything: HQ, field, alerts, trends.
View 1: The HQ Cockpit
For the CEO or marketing director. One page. Everything you need to know.
The 5 Key Metrics
| Metric | Meaning | Check | Target |
|---|---|---|---|
| Publication Rate | How many locations published this month | Weekly | Above 70% |
| Average Engagement | Likes + comments + shares per post | Weekly | Between 2-5% |
| Total Reach | People touched across all locations | Monthly | Track growth |
| Leads | Forms, messages, clicks generated | Monthly | Real ROI |
| Brand Consistency | Posts align with brand guidelines | Monthly | Above 75% |
These 5 metrics are a subset of the 10 essential KPIs for franchise social media, where you will find formulas, thresholds by account size, and tracking frequency for each one.
What You See:
HQ COCKPIT — EYEWEAR NETWORK (50 LOCATIONS)

Publication Rate: 72% (was 68% last month) ↑
Average Engagement: 3.2% (benchmark: 3.1%)
Reach: 145,000 | Per location: 2,900
Leads: 142 this month (€18 per lead)
Brand Consistency: 78%

3-week trend: growth
Best platform: Instagram (54% engagement)
Top location: Bordeaux Central
Alert: 3 locations inactive >14 days
Add a Map
Represent each location by color on a map (Google Maps):
- Green: publishing > 80%, engagement > 4%
- Orange: publishing 50-80% or engagement 2-4%
- Red: inactive for more than 2 weeks
Read the map in 5 seconds: “Ah, Southwest is working, North is sleeping.”
12-Month Charts
Add three trend lines:
- Publishing (progression)
- Reach (growth)
- Cost per lead (you’re optimizing)
The trend tells the story: “January 40% publishing, April 72%. ROI climbing.”
View 2: Location Ranking
For field managers or deployment leads. Who’s winning, who’s sleeping.
Columns to Watch
| Column | What it Means | Target |
|---|---|---|
| Location | Name + code | For reference |
| Publishing | How many times per month | Above 70% |
| Engagement | Interactions per post | Above 2% |
| Followers | Growth this vs. last month | Over 5% monthly |
| Days Inactive | Days since last post | Under 7 days |
| Health Score | Composite (publishing + engagement + growth) | Above 70 |
| Status | Active / Alert / Inactive | Know who to act on |
Real View (top and bottom):
RANKING — SALON NETWORK (100 LOCATIONS)

TOP 5 PERFORMING:
1. Bordeaux Central — 95% publishing, 5.2% engagement, +12% followers, score 92/100
2. Paris 8th — 88% publishing, 4.8% engagement, +9% followers, score 89/100
3. Lyon Presqu'île — 92% publishing, 4.1% engagement, +8% followers, score 87/100
4. Marseille Canebière — 85% publishing, 3.9% engagement, +6% followers, score 84/100
5. Toulouse Centre — 90% publishing, 3.7% engagement, +7% followers, score 83/100

BOTTOM 5 — PROBLEM AREAS:
96. Amiens — 25% publishing, 0.8% engagement, -2% followers, score 18/100, inactive 31 days
97. Calais — 30% publishing, 1.2% engagement, -1% followers, score 22/100, inactive 28 days
98. Lens — 35% publishing, 1.5% engagement, 0% followers, score 28/100, inactive 24 days
99. Arras — 20% publishing, 0.5% engagement, -3% followers, score 15/100, inactive 42 days
100. Abbeville — 10% publishing, 0.2% engagement, -5% followers, score 8/100, inactive 52 days
Alerts: You Need Notifications
- Location inactive for 14+ days: SMS to manager and their supervisor
- Engagement drops >50% in one week: you’re notified
- New location gains 100 followers in a week: show this as a success story
View 3: Performance by Platform
Which channel actually works for YOUR network (not location by location, NETWORK-WIDE).
What You See
| Platform | Avg Reach | Engagement | Cost per Lead | Frequency | Top Content |
|---|---|---|---|---|---|
| 2,400 | 2.1% | €22 | 4x/week | Customer reviews | |
| 1,800 | 4.7% | €18 | 3x/week | Reels, before-after | |
| TikTok | 3,200 | 8.1% | €12 | 2x/week | Quick tutorials |
| Google Business | 890 | N/A | €8 | 2x/week | Hours, reviews |
Insights:
- TikTok has best engagement (8.1%) but requires consistent posting
- Instagram is your best ROI (€18 per lead, 4.7% engagement)
- Google Business is most efficient (€8 per lead) but small reach
- Facebook stable but declining engagement (2.1% trend)
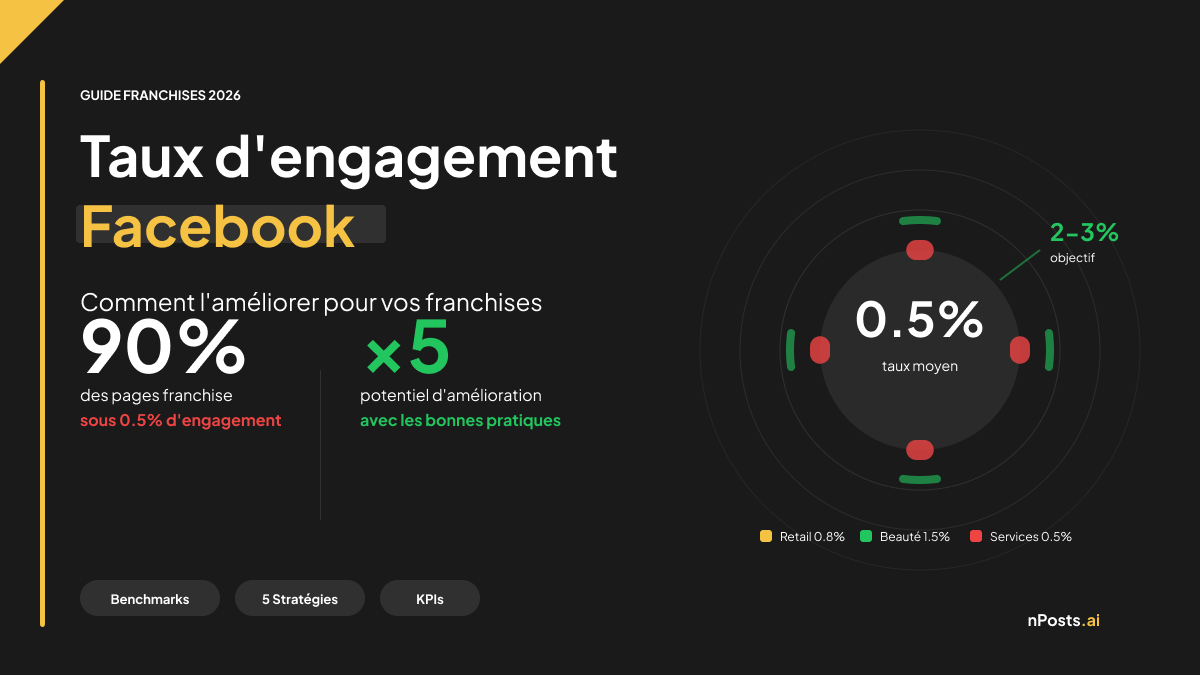
Compare these numbers against the 2026 engagement benchmarks by platform and sector to see where your network stands.
Varies by Industry
- Food & Beverage: TikTok + Instagram (food performs well)
- Hair & Beauty: Instagram Reels + TikTok (transformations drive engagement)
- Eyewear: Google Business + Facebook (local reviews work)
- Real Estate: Instagram + Facebook (photos and testimonials)
View 4: HQ Content Performance
For your community manager and designer. Which content actually works in-store?
Track HQ Posts
Tag and measure each piece once locations publish it:
| HQ Post | Format | Platform | Locations Using | Total Reach | Engagement | Top | Bottom |
|---|---|---|---|---|---|---|---|
| ”5 summer tips” | Carousel | 48/50 | 2,100 | 4.8% | Lyon +156 | Amiens +12 | |
| ”New product” | 15s video | TikTok | 42/50 | 18,500 | 7.2% | Bordeaux +480 | Lens +45 |
| ”Customer review” | Text | 35/50 | 3,200 | 2.3% | Paris +210 | Calais +18 |
Questions to Ask:
- How many locations use this content and publish it?
- Which generates the most engagement?
- Which location overperforms vs. network average?
- What format wins (video vs. carousel vs. text)?
Short Videos Matter
Key stat: videos under 30 seconds generate 2.5x more engagement than text posts (Meta 2025).
If you’re still at 60% text and 40% video, flip that. Go 30% text and 70% video.
Monthly Top 3
Once per month, publish: “Here are this month’s top 3 posts.”
APRIL'S BEST POST
Post: "Quick hair tutorial" (TikTok)
Reach: 24,000 | Engagement: 9.1% | Shares: 128
Used by: 46/50 locations
Leader: Bordeaux (+1,200 reach)

Insight: 9:16 vertical videos outperform 1:1 square by 3.2x.
Action: Create 80% of videos in vertical format.
Location managers see this and want their post in next month’s top 3. It’s healthy competition.
View 5: ROI Report
For the CEO and CFO. One page. The 5 numbers that matter.
ROI REPORT — MARCH 2026
Network: 50 locations

WHAT YOU SPENT:
  Tools (nPosts.ai, analytics): €950
  Creation (CM + designer): €4,200
  Advertising: €3,500
    - Facebook: €1,400 (38 leads)
    - Instagram: €1,600 (44 leads)
    - TikTok: €500 (68 leads)
  MARCH TOTAL: €8,650

WHAT YOU EARNED:
  Leads: 150
  Cost per lead: €57.67
  Industry average customer value: €350
  ROI: 2.96x (150 × €350 / €8,650)

  Reach: 142,000 people
  Average engagement: 3.2%
  New followers: +2,100 (+8.7%)

COMPARED TO FEBRUARY:
  Cost/lead: €62 → €57.67 (8% better)
  ROI: 2.68x → 2.96x (10% better)
  Publishing: 68% → 72% (6% better)

12-MONTH FORECAST:
  Annual budget: €103,800
  Average ROI: 2.85x
  Expected leads: 1,800
  Cost per customer: €57.67
  Revenue generated: €630,000

WHAT'S WORKING:
  ✓ Trend up (+10% ROI vs. February)
  ✓ Reach growing (+8.7%)
  ✓ Publishing stable at 72%
  Alert: 5 locations inactive >14 days (estimated -10% engagement impact)

RECOMMENDATION:
  Keep the budget. Scale Instagram ads (+15% budget allocation).
One A4 page. That’s what the CFO reads before the board meeting. For the methodology behind the ROI calculation, including organic, paid, and global variants, see our franchise social media ROI guide.
How to Build This: Three Paths
Three options based on your technical comfort:
Option 1: All-in-One Platform
nPosts.ai has all this built-in:
- 5 views ready to use (cockpit, ranking, platform, posts, ROI)
- Meta + Google Business integration (automatic)
- Inactive location alerts built-in
- PDF reports export monthly
Cost: €59-79 per location per month (scales down as you grow). For a complete cost breakdown by network size, see our franchise social media budget guide. Technical skill: zero. Just works.
Option 2: General Business Intelligence
DashThis:
- Connects Meta, Google, LinkedIn
- Pre-built dashboard templates
- Custom alerts
- PDF export
- Cost: €300-600 / month
- Gap: no franchisor-specific scoring (inactive detection, auto alerts)
Sprout Social:
- Social CRM + analytics
- Publishing + analytics
- Report templates
- Cost: €500-1,500 / month
- Gap: same. Not built for franchise networks.
Option 3: DIY (If You Code)
Google Sheets + Data Studio, for tech-savvy teams with tight budgets:
- Extract data via Meta and Google APIs (Python script)
- Centralize in Google Sheets
- Visualize with Data Studio
- Automate with Google Apps Script
Cost: nearly free (few hours dev setup). Maintenance: 5-10 hours monthly. Technical skill: high. For developers only.
Quick Comparison
| Tool | Setup Time | Monthly Cost | Alerts | Ranking | Technical | |
|---|---|---|---|---|---|---|
| nPosts.ai | 1 day | €59-79 | Yes | Yes | Yes | None |
| DashThis | 3 days | €400 | Limited | No | Yes | Medium |
| Sprout Social | 1 week | €800 | Yes | No | Yes | Medium |
| Google Sheets + Studio | 2 weeks | €0 | No | Custom | Limited | High |
7 Weeks to Launch
Week 1: Define Objectives
- Target publishing rate (e.g., 70% minimum)
- Target engagement by platform
- Acceptable cost per lead (e.g., under €25)
- Minimum ROI (e.g., 2.5x)
Week 2: Choose Your Tool
- Demo 2-3 solutions (nPosts.ai, DashThis, Sprout)
- Test for one week on 5 locations
- Cost vs. value: what do you actually gain?
Week 3: Connect Data
- Grant API access to Meta and Google
- Register each location account in the tool
- Wait 7 days and verify numbers are correct
Week 4: Build Your Views
- HQ cockpit: your 5 main metrics
- Location ranking: top and bottom with alerts
- Platform performance: which channel works
- Content tracking: which HQ posts get used
Week 5: Set Up Alerts
- Location inactive 14+ days = notification
- Engagement drops >30% in one week = notification
- New location gains 100 followers = showcase as example
Week 6: Prepare Monthly Report
- Create ROI report template (5 metrics)
- Automate sending on 1st of month
- Present to leadership team
Week 7: Present to Network
- Demo for locations
- Train them to read their individual ranking
- Collect their feedback
The Summary
A franchise-first dashboard changes everything. You move from “I hope this works” to “I see exactly what works and why.”
The 5 views (cockpit, ranking, platform, content, ROI) give everyone what they need: HQ manages the network, locations benchmark fairly, the CEO justifies the budget.
Need to do this without coding? nPosts.ai has this built-in.