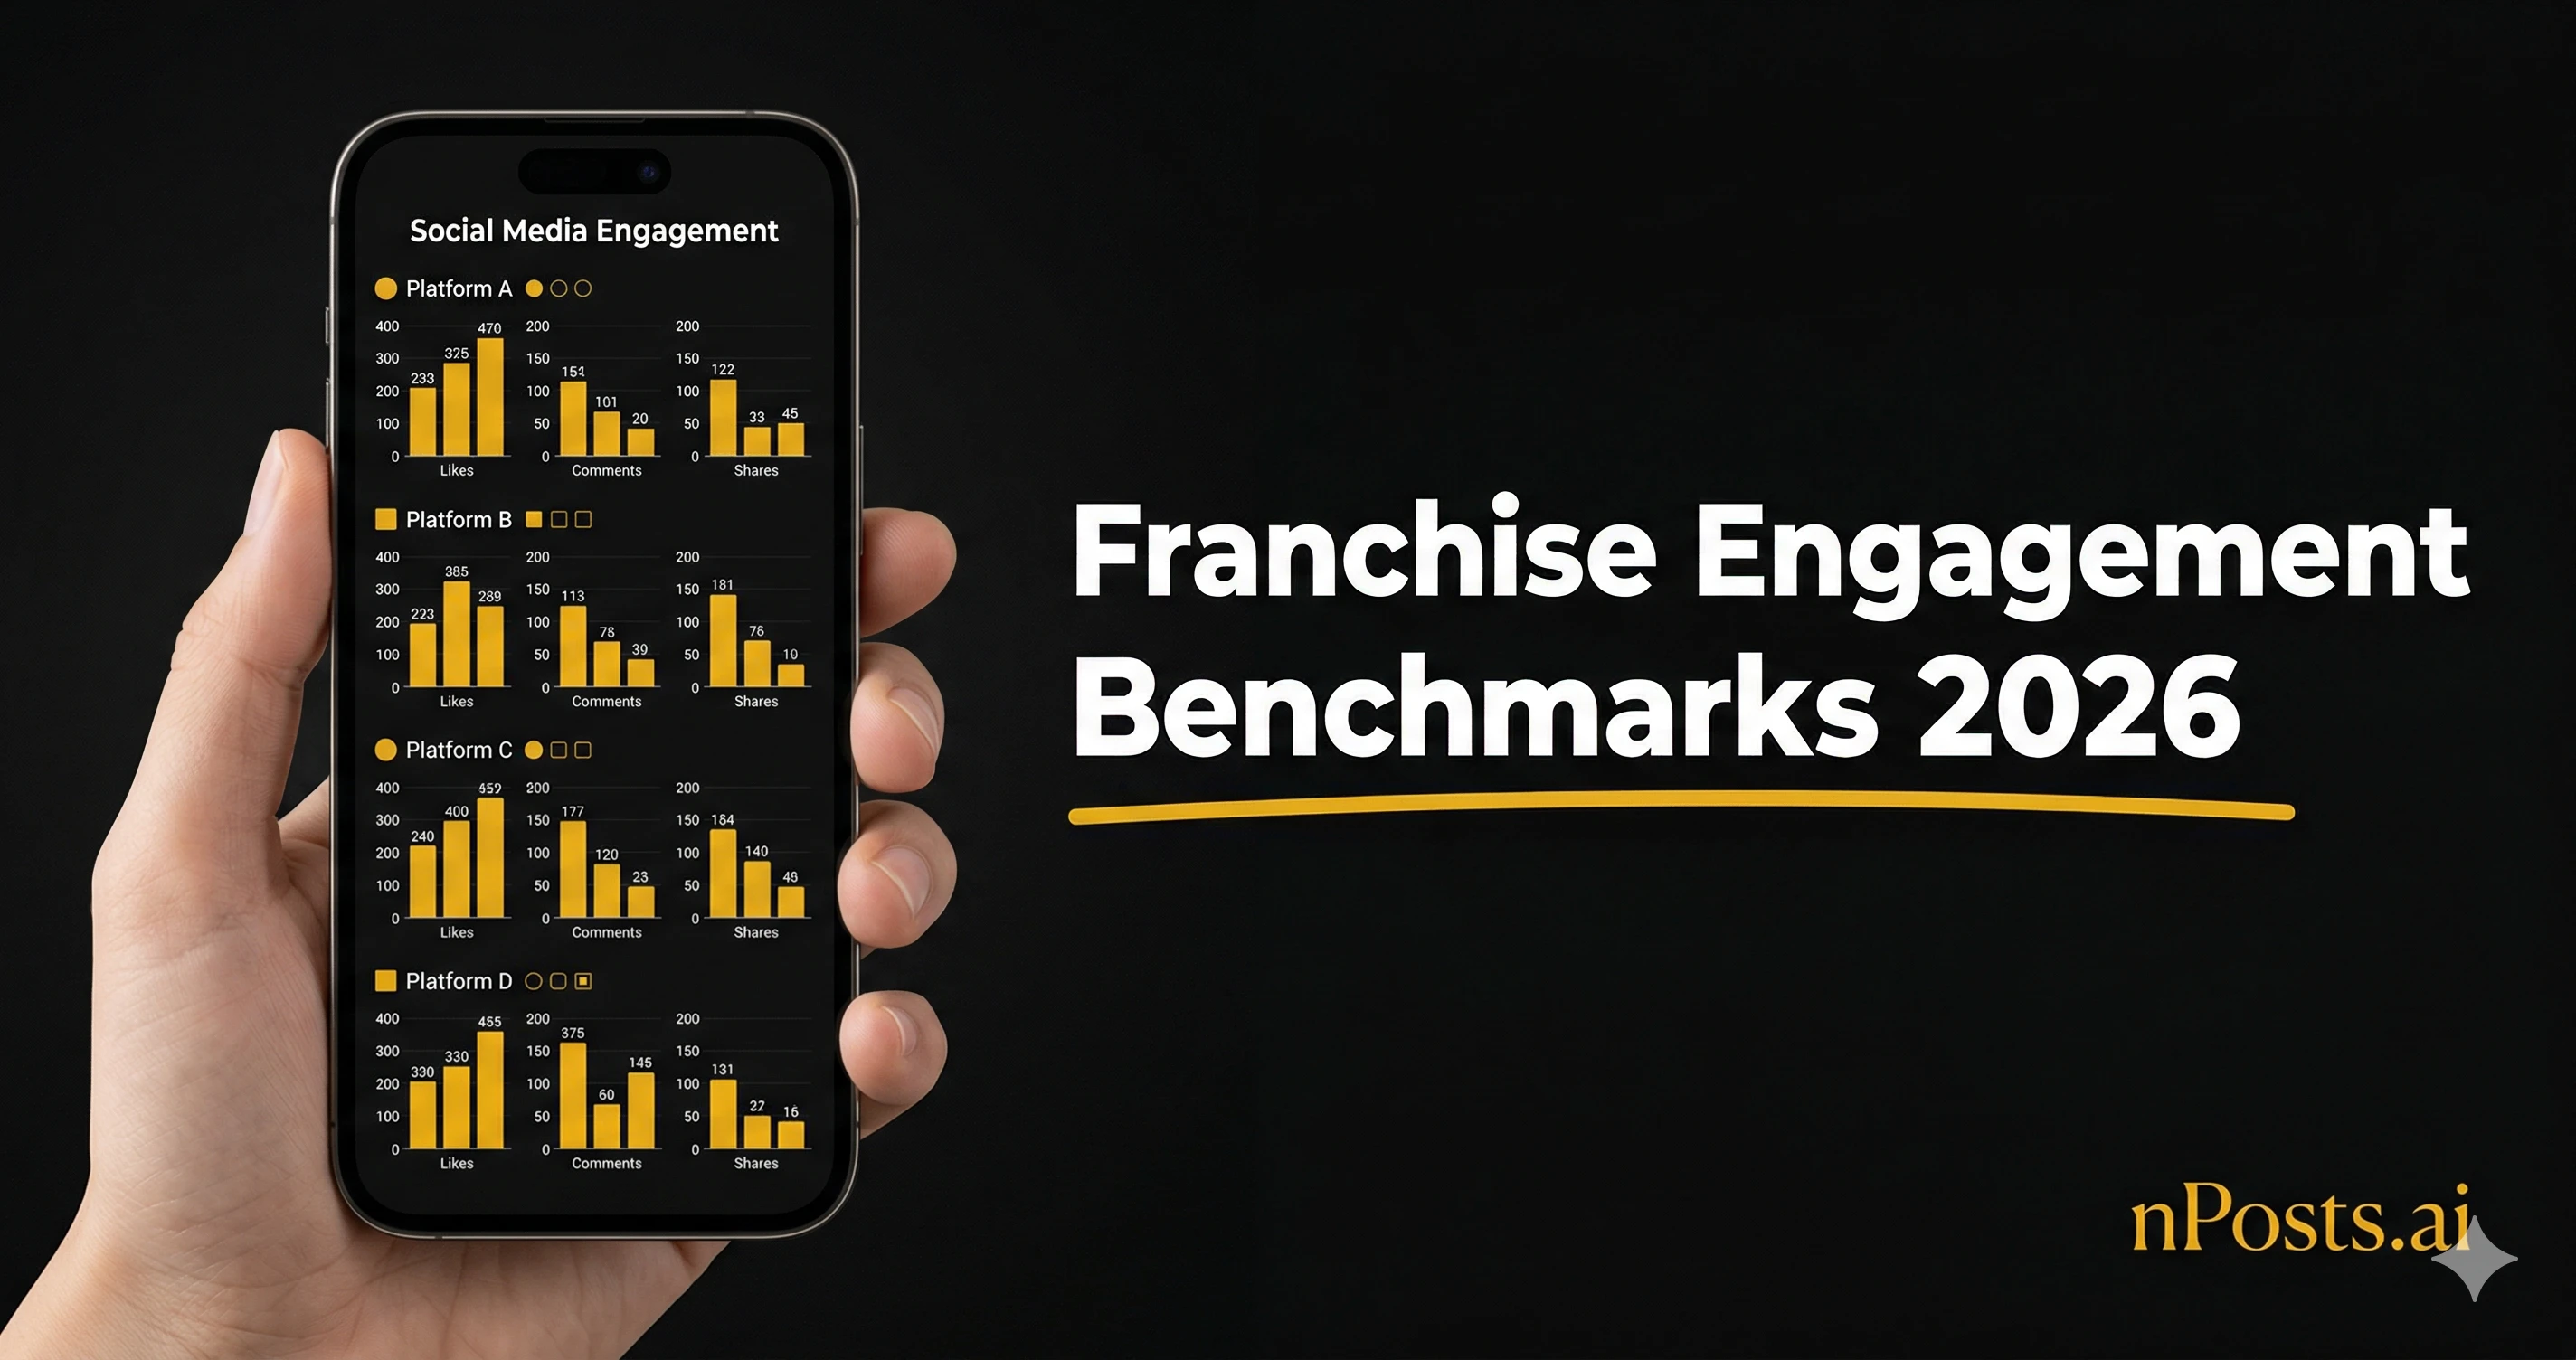
Franchise Social Media Engagement Benchmarks: Where Do You Really Stand?
You post regularly across your network’s social channels, but you’re asking yourself the real question: Am I keeping up with the competition? Are your engagement rates normal? Are your franchisees actually performing?
This article gives you the 2026 numbers to evaluate your real performance and identify where you’re lagging.
2026 Engagement: Global Figures by Platform
The trends from 2025 are holding steady: not all networks engage equally. Here’s what we’re actually seeing:
| Platform | Average Engagement Rate | YoY Change | Trend |
|---|---|---|---|
| TikTok | 3.70% | +49% | ✅ Explosive growth |
| 3.85% | +12% | ✅ Steady growth | |
| 0.48% | -2% | ➡️ Stable | |
| 0.15% | -18% | ❌ Persistent decline | |
| YouTube Shorts | 2.14% | +35% | ✅ Rising momentum |
Sources: Social Insider (52M+ posts), Buffer 2026 Report, Hootsuite Q1 2026.
What These Numbers Mean
Engagement is straightforward: interactions (likes, comments, shares, clicks) divided by impressions, expressed as a percentage.
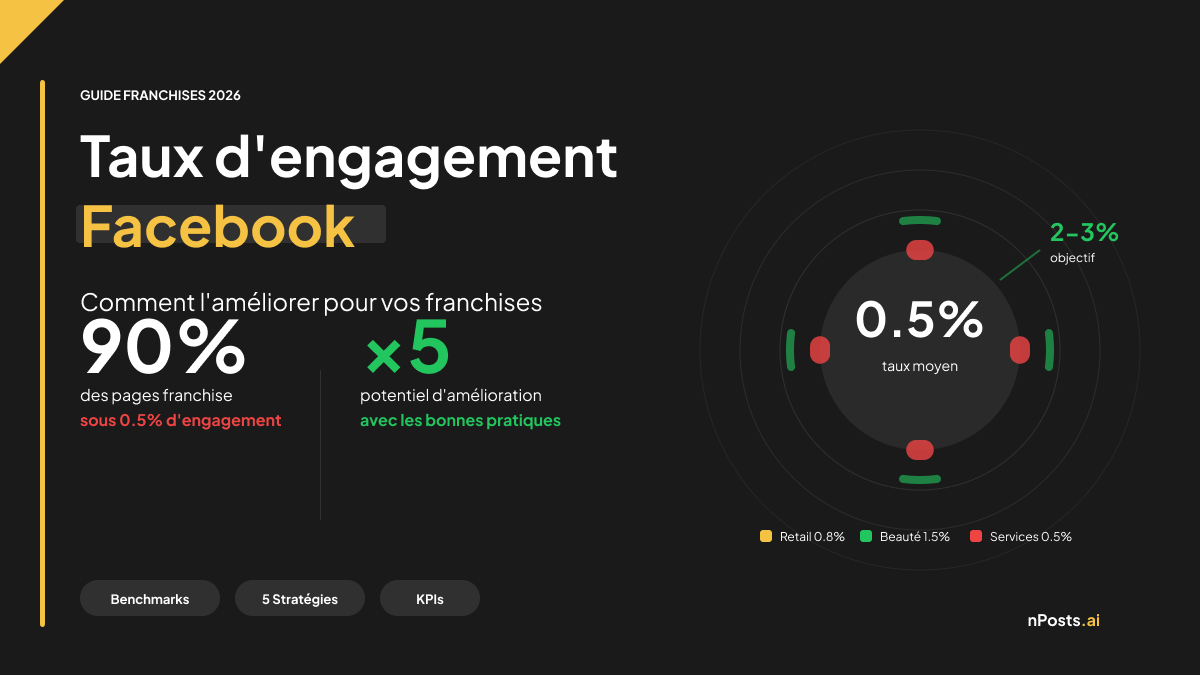
A 0.15% rate on Facebook seems odd at first — we explored this in detail in our Facebook engagement rate analysis for franchises. But look closer:
- It’s the global average across all accounts
- Small accounts (individual locations) perform much better
- Large national brands drag everything down
What changes everything for franchises: small accounts outperform.
The Local Page Advantage: Why Your Small Stores Beat You
Here’s something that surprised me after 25 years in retail: smaller accounts drive significantly higher engagement.
Buffer measured this across 800K+ accounts in 2026. Results by account size:
| Number of Followers | TikTok | |||
|---|---|---|---|---|
| < 10K | 4.7% | 2.8% | 0.85% | 2.4% |
| 10K–100K | 3.2% | 1.2% | 0.32% | 1.8% |
| 100K–1M | 1.8% | 0.6% | 0.18% | 1.2% |
| > 1M | 0.9% | 0.35% | 0.12% | 0.8% |
Why? Four reasons I’ve seen firsthand in my retail centers:
-
Human connection — When someone follows a local store’s account, they recognize the manager, staff, the team. It’s personal. Facebook and TikTok reward this and boost it.
-
Algorithms prefer authenticity — Meta and TikTok favor content created by real people. Not overly polished “corporate” posts. A candid team photo outperforms a product shot.
-
Hyper-qualified geographic audience — A potential customer 5 km from your store finds you relevant. Different story if you’re 200 km away.
-
More active conversation — Smaller account = more comments, genuine feedback. People ask questions, leave reviews. Not bots.
I’ve seen it: an optical network with 50 small stores collectively engages 10 to 15 times more than a single head office page. That’s the franchise network’s secret weapon — and it directly impacts your social media ROI as a franchise.
Sector Benchmarks: Retail, Real Estate, Food, Beauty, Fitness
Performance varies by sector. Here’s what Hootsuite, Social Insider, and Sprout Social see in 2026 for the sectors I focus on:
Retail Sector (Optical, Beauty, Fitness)
| Platform | Engagement | Optimal Frequency | Winning Content |
|---|---|---|---|
| 3.66% | 25 posts/week | Before/afters, product try-on | |
| 1.54% | 18 posts/week | How-to articles | |
| TikTok | 1.74% | 4–5 posts/week | Trends, tutorials |
| 4.15% | 15 posts/week | Industry expertise, news |
Real Estate Sector
| Platform | Engagement | Optimal Frequency | Winning Content |
|---|---|---|---|
| 2.84% | 20 posts/week | Virtual tours, before/after | |
| 1.21% | 14 posts/week | Local market news | |
| TikTok | 1.42% | 3–4 posts/week | Neighborhood discovery |
| 3.97% | 12 posts/week | Market insights |
Food Sector (Restaurants, Bakeries)
| Platform | Engagement | Optimal Frequency | Winning Content |
|---|---|---|---|
| 4.21% | 22 posts/week | Dishes, process, behind-the-scenes | |
| 1.87% | 16 posts/week | Menus, local events | |
| TikTok | 2.56% | 5–6 posts/week | Recipes, challenges |
| 2.14% | 10 posts/week | Hiring, innovation |
Sources: Hootsuite 2026 Industry Report, Sprout Social Benchmarks Q1–Q2 2026.
How to Read These Benchmarks
If your Food/Instagram posts hit 2.4%, you’re 40% below the 4.21% target. That’s potential to capture. If your Retail/LinkedIn posts reach 5.8%, maintain that. You’ve found a format that works.
Winning Formats 2026: Short-Form Video, Carousels, and Local Content
Short-form video is winning everywhere. Here’s what you actually need to do:
Short-Form Video (< 60 seconds)
Real impact: 2.5× more engagement than static photos.
Figures by platform:
- TikTok: 4.8% average (native format, no surprise)
- Instagram Reels: 3.1% average
- YouTube Shorts: 2.8% average
- Facebook Video: 1.2% average
Formats that work:
- Quick tutorials (“How to do X in 30 seconds”)
- Behind-the-scenes and authentic moments
- Before/after
- Challenges or trends adapted to your sector
- Customer testimonials (15–20 seconds)
Field tip: One short video headquarters-wide per week. Distribute to all franchisees. They republish directly or adapt locally. Volume × locality = the winning combo.
Instagram Carousels
Impact: 3.6% engagement (vs 0.48% Instagram average).
Why it works: People scroll longer = more time on post = stronger algorithm signal. The narrative structure (page 1 hook → pages 2–5 detail → page 6 CTA) creates real progression.
Examples: “5 mistakes when buying glasses,” “Restaurant hiring guide.”
LinkedIn Video
Impact: 4.3% for native videos.
Key point: autoplay without sound. Therefore captions are mandatory.
Formats for franchises:
- Franchisee or manager testimonials
- Real case studies (“How we increased sales 35%”)
- Sector news commentary
- Expansion announcements or new locations
Facebook Albums
Impact: 1.9% (vs 0.15% Facebook average).
Often overlooked but highly effective. Photo galleries create actions (clicks) that algorithms reward. Ideal for events or product catalogs.
Real Cases: 3 Networks That Actually Changed Their Results
I prefer real numbers to theory. Here’s how 3 networks used benchmarks to progress. 2025–2026 data, verified figures:
Case 1: Retail Network (Optical) — 28 Stores
Starting point:
- Instagram: 1.8% engagement (vs 3.66% benchmark)
- Content: static frame photos + some text posts
- Publishing: 8 posts/week from HQ, 34% of franchisees republished
Identified problem: Content too generic, not local enough, insufficient video.
What they did (First 3 months):
- Video pivot: 1 “try-on” video per week (15 seconds)
- Weekly carousels: “5 frame shapes for your face type”
- Authentic behind-the-scenes: opticians consulting with customers
- Frequency: 8 → 15 posts/week from HQ
Results after 3 months:
- Instagram engagement: 1.8% → 3.2%
- Franchisees republishing: 34% → 62%
- Leads generated: 18/month → 54/month (tripled) — lowering cost per lead by over 60%
Takeaway: Video + simple distribution (republish, not create) = franchisee adoption rises, metrics shift.
Case 2: Food Network (Restaurants) — 15 Locations
Starting point:
- TikTok: no presence (0 = 0 engagement)
- Instagram: 2.1% (vs 4.21% benchmark)
- LinkedIn: nothing
Diagnosis: Missing TikTok despite young audience (18–35) interested in food.
What they did (2 months):
- 4 TikTok videos per week from HQ (recipes, process, challenges)
- Identify 3 “natural” franchisees on TikTok (they always exist)
- Train these 3 to adapt (not create) the videos
- Instagram: increase videos (2 → 5/week)
Results after 2 months:
- TikTok: new account + 8K followers, 2.8% engagement
- Instagram: 2.1% → 3.7% engagement
- Store traffic: +12% (measured via UTM + visits)
Takeaway: Local champions + native format = rapid growth. No need to train everyone, just the right ones.
Case 3: Real Estate Network (Agencies) — 22 Agencies
Starting point:
- LinkedIn: 0.8% engagement (vs 3.97% benchmark)
- Focus: B2C only (buyers)
- Content: property listings (low engagement by nature)
Diagnosis: LinkedIn underutilized. But agents also have B2B clients (investors). Double market forgotten.
What they did (3 months):
- LinkedIn posts: market insights (average prices, area trends)
- Agent videos (20 seconds): “I found a client a 3-bedroom at €280K with 15% ROI”
- Frequency: 3 posts/week from HQ
- Encourage agents to republish locally (with UTM)
Results after 3 months:
- LinkedIn: 0.8% → 3.2% engagement
- External recruiting cost: -40% (thanks to visibility)
- B2B leads (investors): 12 new per month
Takeaway: Redefine your strategy completely. Don’t go B2C only—add B2B. Content changes entirely.
Framework: Track Your Benchmarks Month After Month
Collect the numbers, yes. But act on them. Here’s the process:
Week 1: Your Real Baseline
Consolidate 3 months of data by platform. Example retail network:
- Instagram: 2.1% average (gap: -43% vs 3.66% benchmark)
- Facebook: 1.34% average (gap: -13% vs 1.54% benchmark)
- TikTok: 0 posts (impossible to measure)
Months 1–2: Progressive Targets
Goal: close 50% of the benchmark gap in 6 months.
Instagram 2.1% → 2.88% (50% of the way to 3.66%).
The path: diversify toward short-form video (you’re currently doing less).
Months 3–6: Measure by Format and Platform
- Video content: Target 3.5%+ on Instagram
- Carousels: Target 3.2%+ on Instagram
- Static posts: Target 2.0%+ on Instagram
Not one general average. Format by format.
Quarterly: Recalculate
Baseline → Q1 → Q2 → Q3. Compare your progress vs sector benchmark.
3 months is the timeframe to see real change (new content, new format, new voice).
The Rarely-Asked Analysis: Why Your Benchmarks Could Be Completely Wrong
Before you compare yourself, here’s hidden reality behind the numbers.
Who Publishes Benchmarks (And What They Actually Measure)
- Social Insider (52M+ posts): Ad networks, e-commerce, agencies. Bias = accounts with large ad budgets. Not representative of franchises.
- Buffer (800K+ accounts): Mix of public and small accounts. Closer to franchise reality.
- Hootsuite (500K+ managed accounts): Paying clients = professionals. Bias = already-mature accounts.
- Sprout Social (300K+ accounts): Medium-to-large companies. Bias = B2B heavy.
Impact: Benchmarks often ignore micro-franchises (< 5K followers). You naturally outperform. That’s an asset.
The Reality of Small Accounts (< 5K Followers)
When you have a store account (500–2,000 followers), the rules shift:
- Algorithm: Favors local and authentic pages. You’re in a strong position.
- Conversation: Denser. 10 comments on 50 followers = 20% rate. Vs 500 comments on 100K = 0.5% rate.
- Off-topic content performs better: A team lunch photo engages more than a product sheet.
Implication: Don’t get discouraged if you beat the benchmarks. It’s normal. It’s an advantage, not a calculation error.
The Trap of Averages
Benchmarks are averages. They hide a lot:
- Restaurant with excellent cuisine → 6.8% on Instagram (vs 4.21% benchmark)? Normal. Cuisine beats format.
- Beauty with tutorials = best practice → 1.2% engagement? Execution or timing problem.
Real action: Compare by format (video vs image, tutorial vs announcement, etc.). More useful than raw comparison.
Seasonal Variations Nobody Mentions
Benchmarks annualize. Reality is seasonal.
Food:
- January (New Year Resolutions): +25% fitness/salad engagement
- February (Valentine’s Day): +45% gourmet restaurant engagement
- July/August (Vacation): -35% global engagement
Real Estate:
- March–May (Spring, active buyers): +40% engagement
- September (Back-to-school): +30% engagement
- November–December: -20% engagement
Reality: Chasing February benchmarks in July = mistake. Adjust targets seasonally.
Publishing Frequency: The Sweet Spot for Franchisees
For franchises, there’s a balance: enough to stay visible, not so much it overloads staff.
Retail (Optical, Beauty, Fitness)
- Instagram: 25 posts/week (3–4/day) = 12–15 posts/location/month
- Facebook: 18 posts/week (2–3/day) = 9–10 posts/location/month
- TikTok: 4–5 posts/week (1/day) = 4–5 posts/location/month
- LinkedIn: 15 posts/week (2/day) = 7–8 posts/location/month
Real Estate
- Instagram: 20 posts/week = 10 posts/agency/month
- Facebook: 14 posts/week = 7 posts/agency/month
- TikTok: 3–4 posts/week = 3 posts/agency/month
- LinkedIn: 12 posts/week = 6 posts/agency/month
Food
- Instagram: 22 posts/week = 11 posts/location/month
- Facebook: 16 posts/week = 8 posts/location/month
- TikTok: 5–6 posts/week = 5 posts/location/month
- LinkedIn: 10 posts/week = 5 posts/location/month
Franchise reality: Most franchisees publish 3–5 posts/week per location across all networks. Realistic if content comes ready from HQ.
That’s why nPosts.ai works: it distributes HQ content to each location. Instead of asking franchisees for 25 creations/week (impossible), you offer 3–5 ready-made. Adoption rate: 15% to 80%.
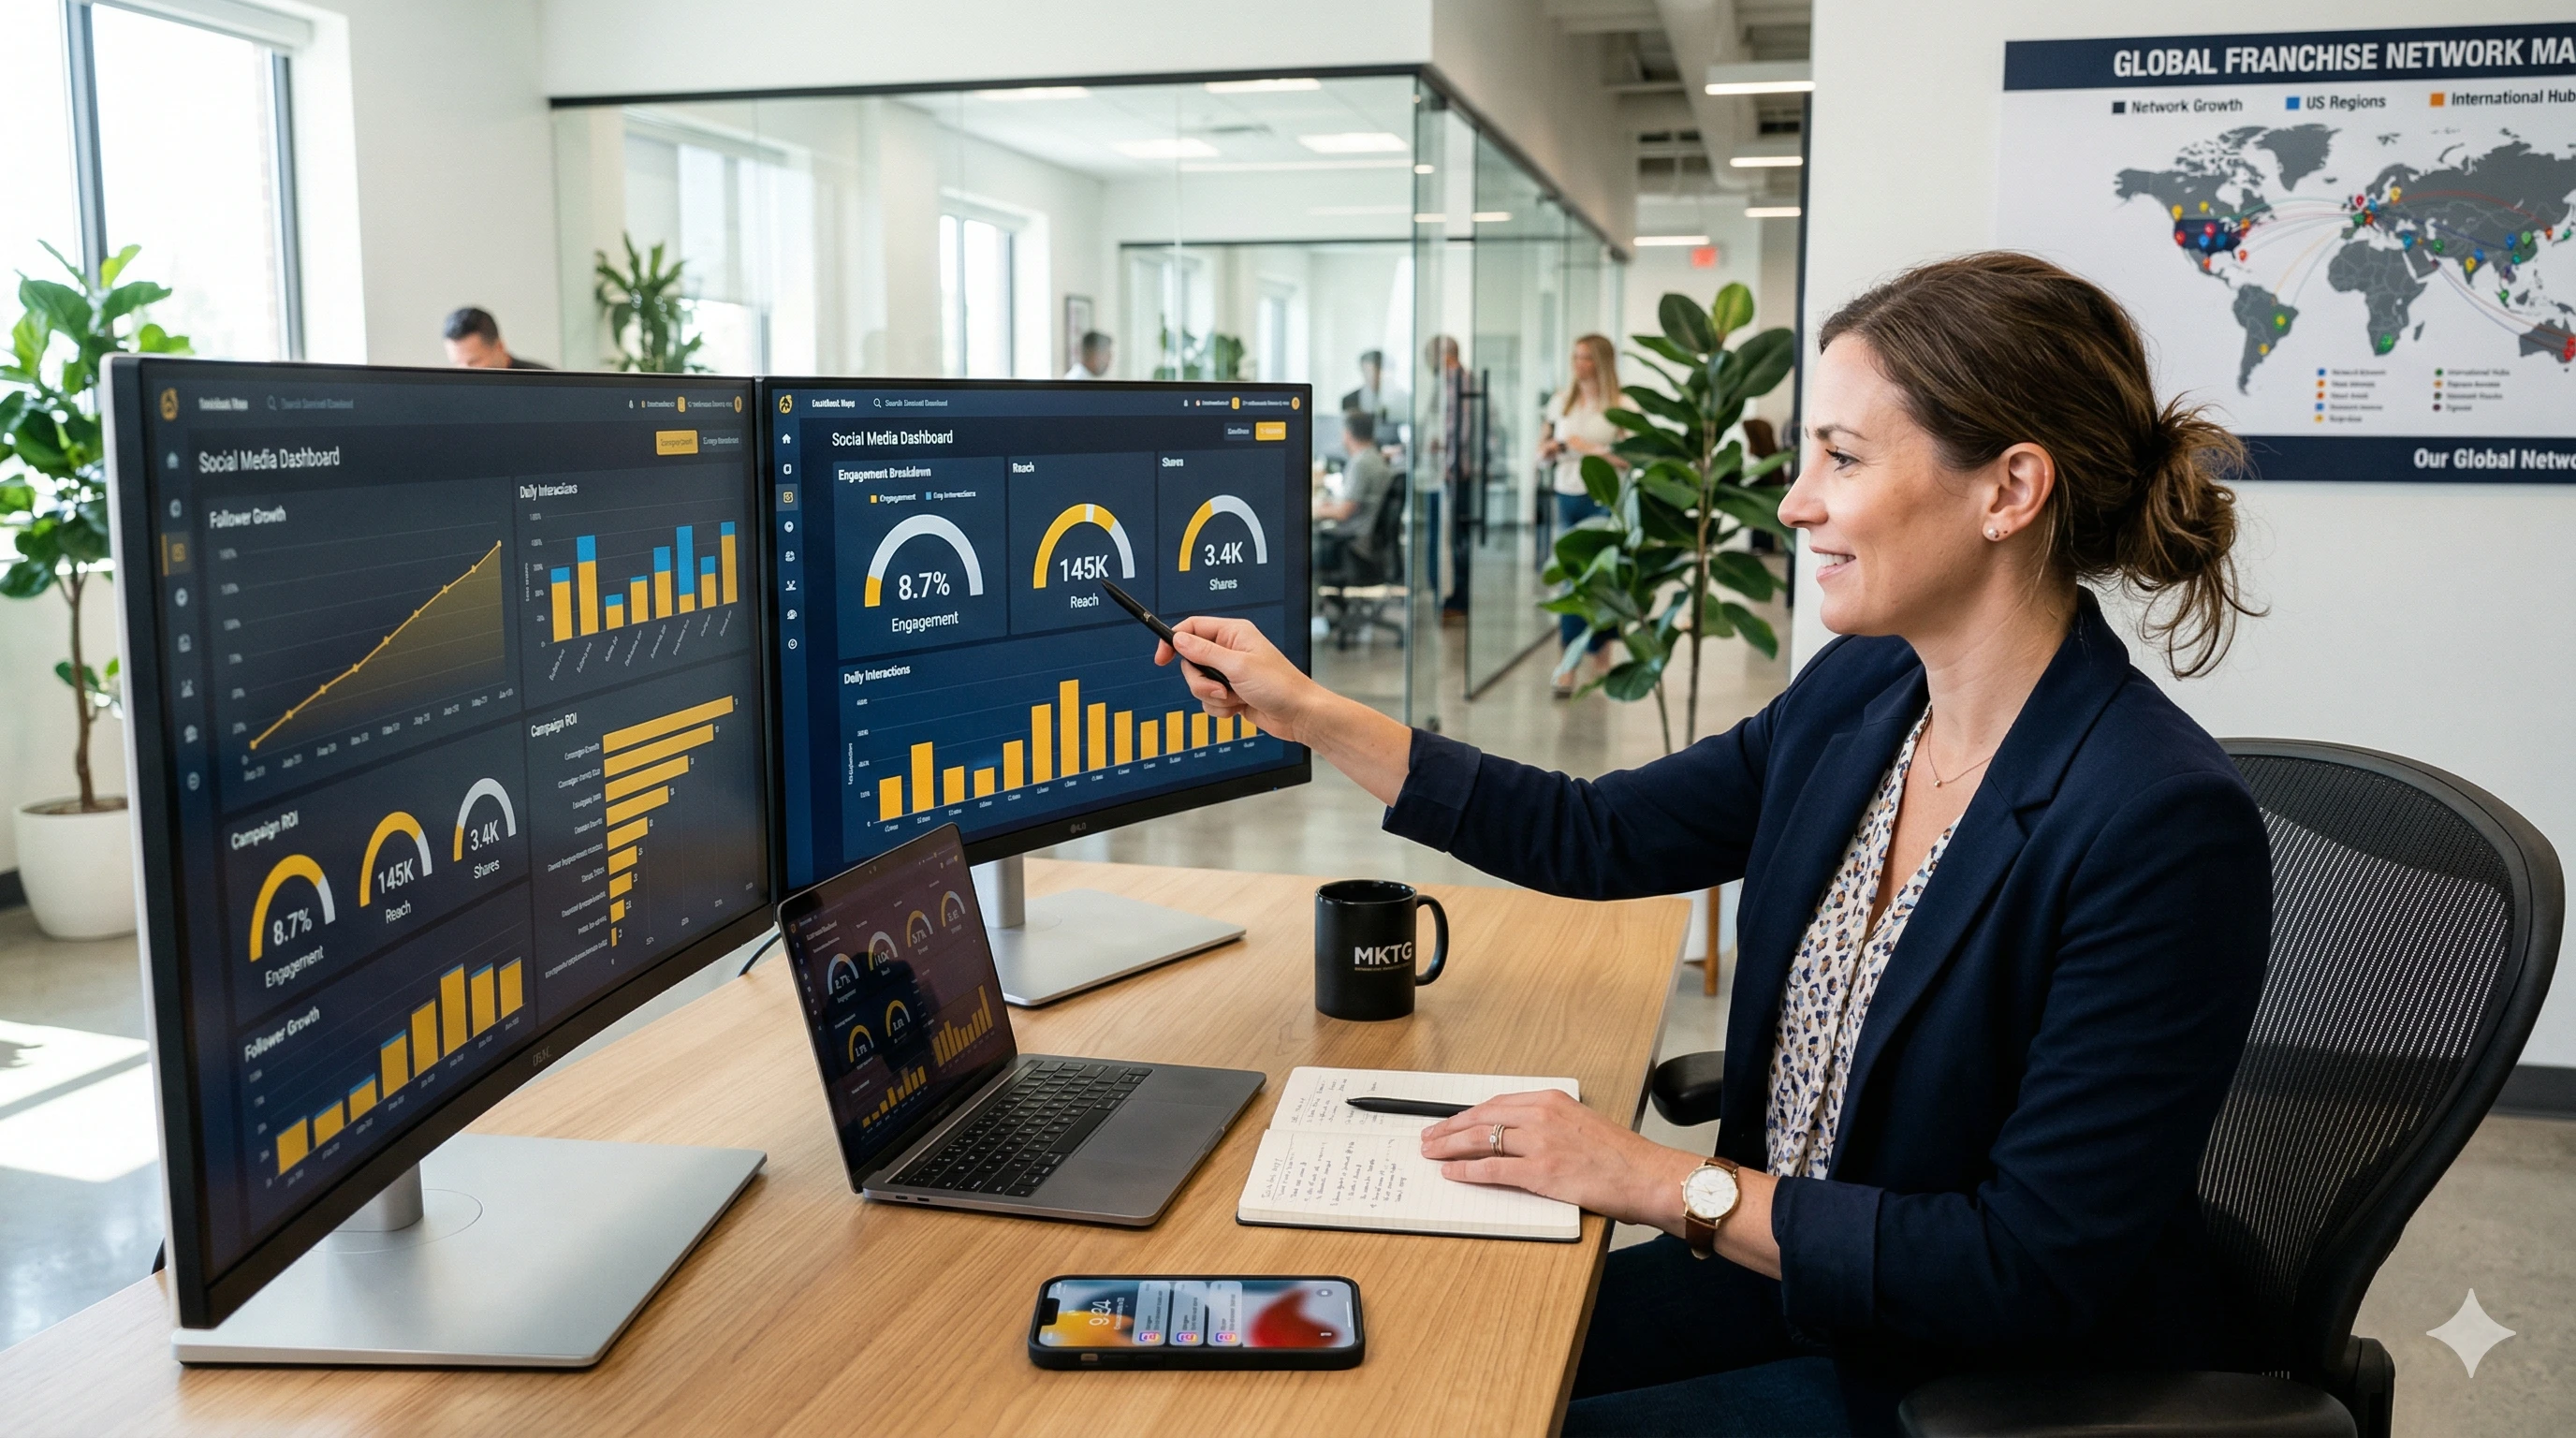
Tracking Dashboard: The Right Metrics to Monitor
Having benchmarks is one thing. Tracking them properly is another.
4 Minimum Metrics Per Platform
These four metrics are part of the broader set of 10 essential KPIs for franchise social media that every network director should monitor.
| Metric | Formula | Target | Frequency |
|---|---|---|---|
| Engagement rate | (Likes + Comments + Shares) / Impressions × 100 | vs sector benchmark | Weekly |
| Average reach | Total impressions / Number of posts | 10% month-over-month growth | Weekly |
| CTR (Click-Through Rate) | Clicks / Impressions × 100 | vs your history | Weekly |
| Audience share | Followers / Average impressions | > 5% = engaged audience | Monthly |
For a more complete reporting setup, see our guide to building a franchise social media dashboard with 5 ready-to-use views including location rankings and automated alerts.
Quick Setup: Google Sheets + Zapier
20 minutes:
- Google Sheets with columns: Date, Platform, Posts, Impressions, Engagement, %, Benchmark
- Meta (Facebook/Instagram): Connect via Meta Business Suite API → Zapier → Sheets (daily auto-sync)
- TikTok: Export monthly analytics → Paste into Sheets
- LinkedIn: Export analytics → Paste into Sheets
- Sheets formulas: Calculate %, gaps vs benchmark, trend (sparkline)
Example Sheets row:
2026-04-05 | Instagram | 8 posts | 12,000 impressions | 345 engagements | 2.88% | Benchmark: 3.66% | Gap: -21%
Review Cadence
- Weekly: Which format engages best? Identify weak posts.
- Monthly: Monthly averages. Compare vs benchmark + vs last month.
- Quarterly: Full strategy review. Change format? Increase volume? Adjust frequency?
Internal Benchmark: Create Your Own References
Don’t just compare to global figures. Build your internal benchmarks:
Example Retail:
- Best Instagram Reels (before/after): 6.2% engagement
- Worst format (text carousel): 1.1% engagement
- Internal gap: 5.1 points
Action: Increase Reels to 20% of creative budget. Reduce text carousels.
Example Food:
- “Behind-the-scenes prep” posts: 5.8% (vs 4.21% benchmark)
- “Menu announcement” posts: 2.1% (vs 4.21% benchmark)
Action: Increase behind-the-scenes. Overhaul announcements (video instead of photo).
This approach is more useful than chasing general benchmarks: you target your specific levers.
The 5 Keys to Beat Your Benchmarks
-
Invest in short-form video — #1 format in 2026. Generate 2–3 videos of 30–60 seconds per week from HQ.
-
Publish locally — Let franchisees adapt. A Paris store and a Lyon store have different customers. 1 HQ post → 3 local variations in one click.
-
Native captions mandatory — Videos with captions engage 1.5–2× more (public transit, work, no sound).
-
Stay consistent — Regular frequency engages more than sporadic spikes.
-
Analyze your top performers — Find the formats and times that work. Replicate.
In summary: use these benchmarks to identify your levers, not to compare yourself to others. Your locations have one huge advantage: local authenticity. Maximize it.
Your franchisees publish rarely and you have no visibility on their social performance? Discover how nPosts.ai automates content distribution to your network. Publishing rate from 15% to 80% in weeks.