You’re staring at your dashboard with 47 columns. Engagement, reach, impressions, shares, mentions, growth rate, sentiment score, response time. Your teams are drowning. So are you.
The real problem? You’re measuring everything except what matters.
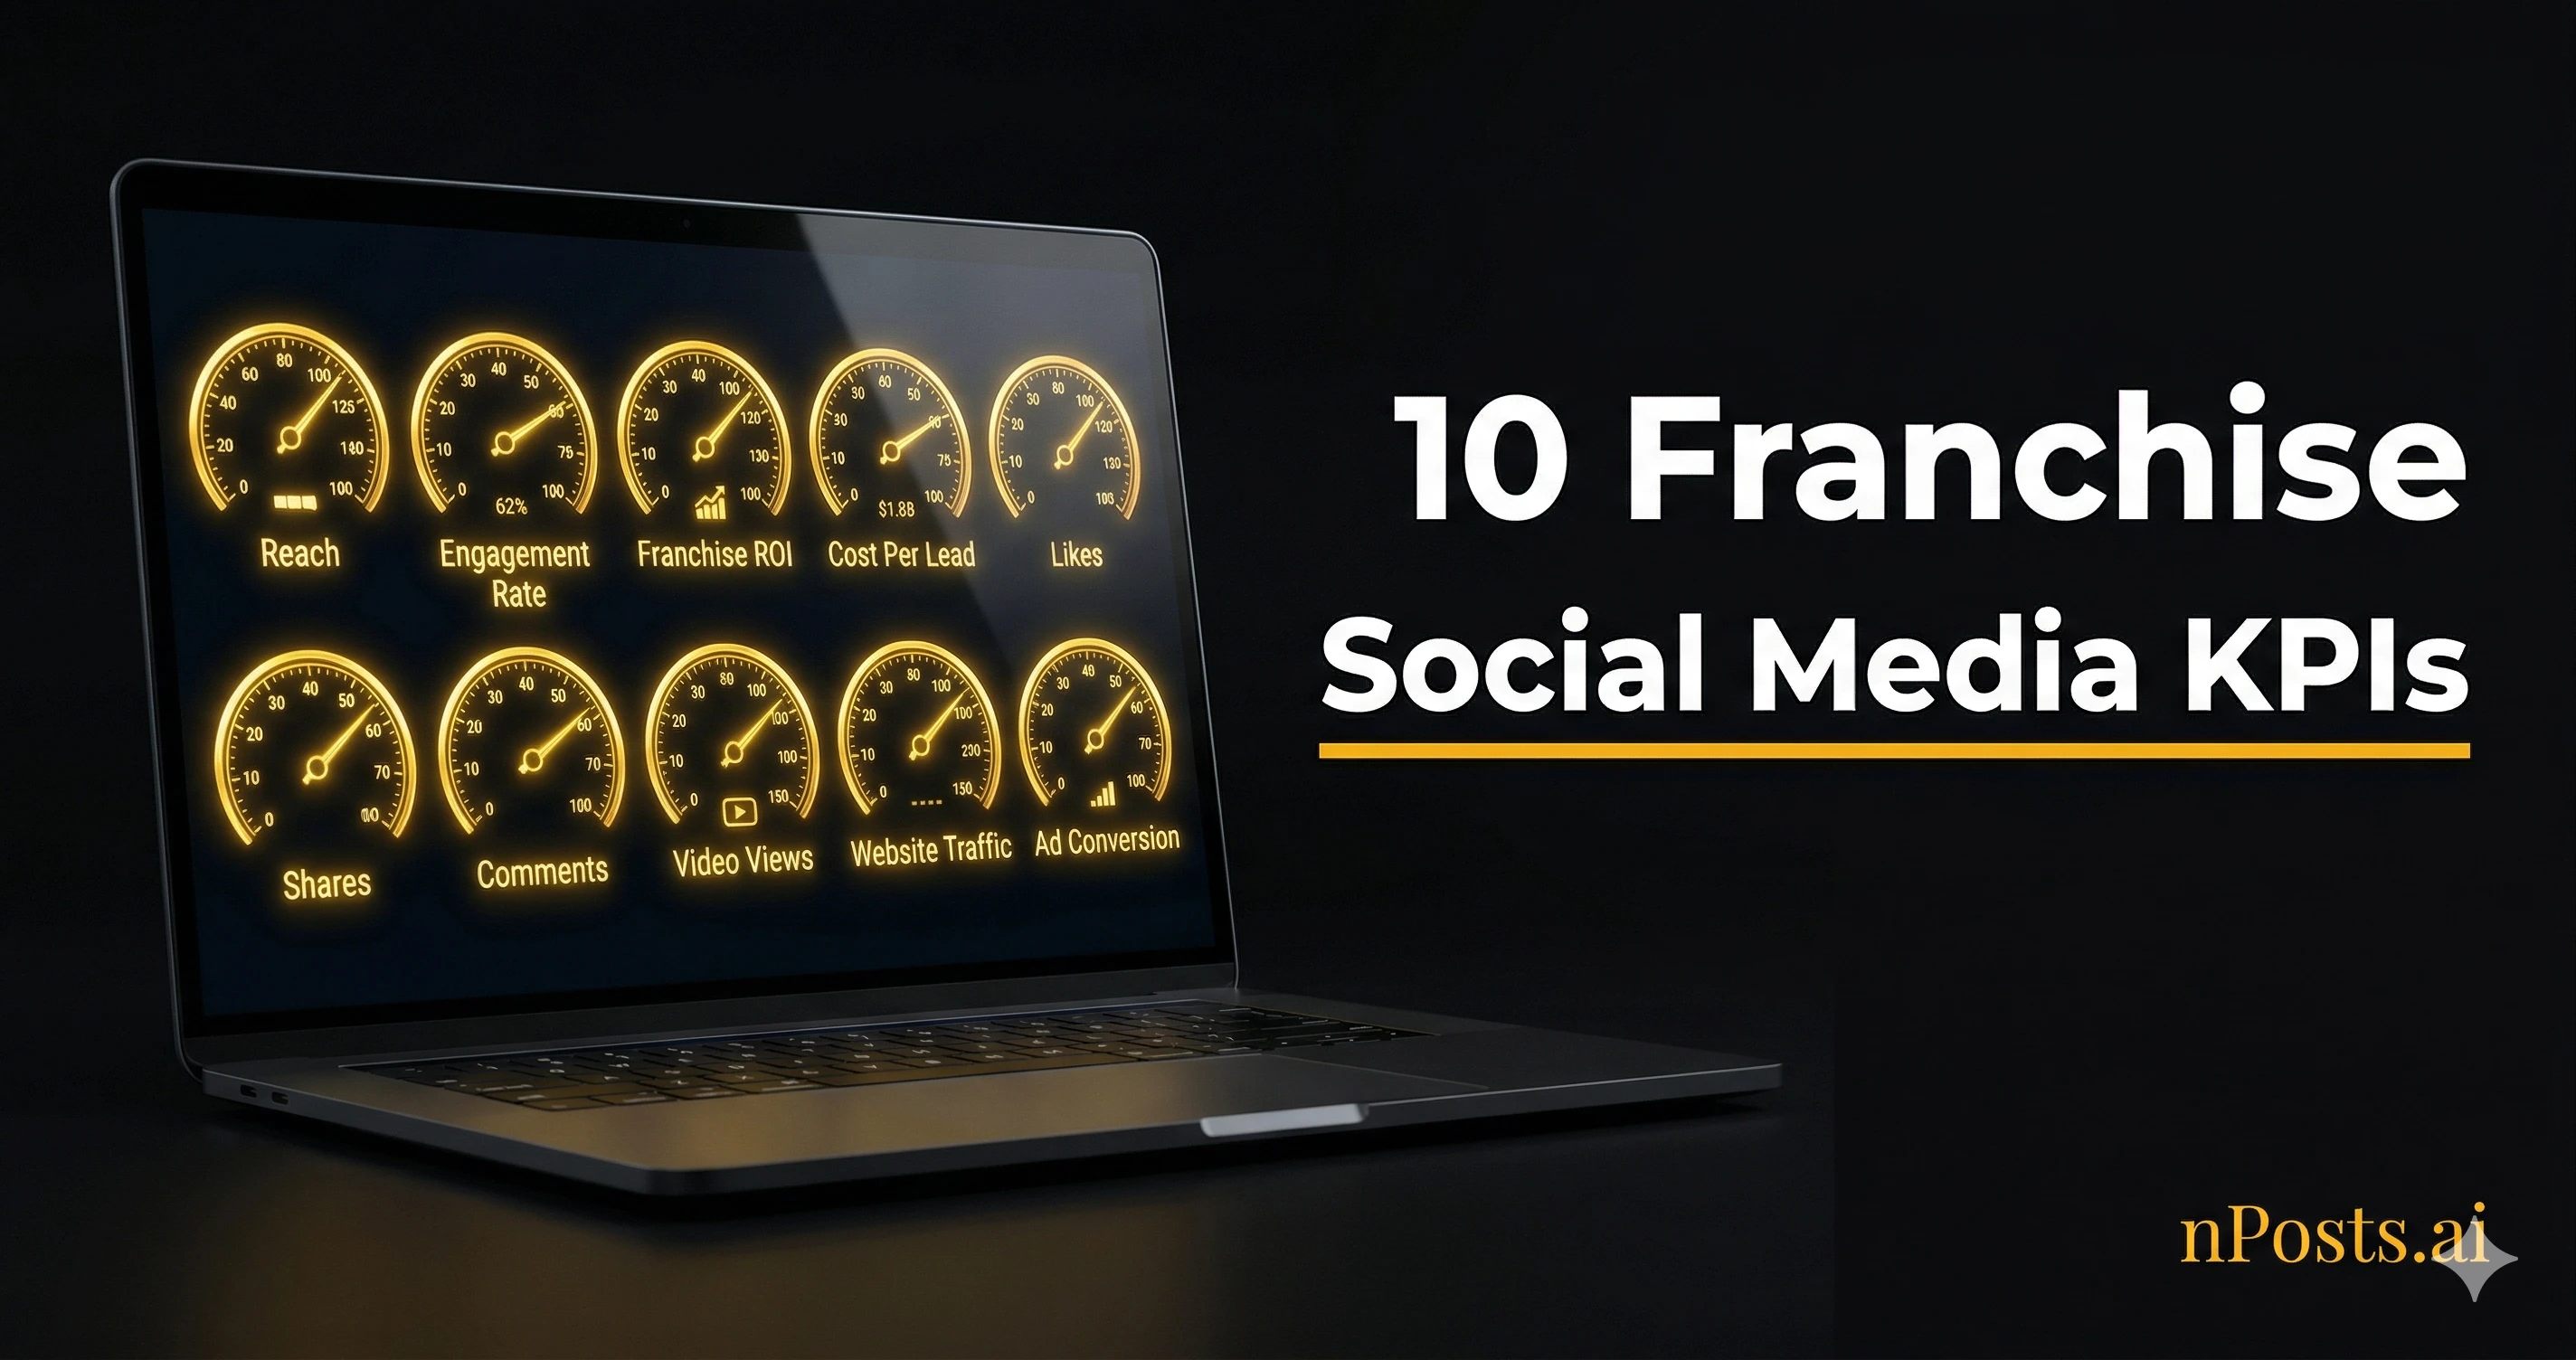
This article gives you the 10 metrics that actually drive a franchise network. No more, no less. Each has a formula, a threshold, and a tracking frequency. At the end, a downloadable template.
Why generic thresholds fail in franchising
You’ve probably read somewhere: “normal engagement rate is 1%.” Good intent. Bad execution in franchising.
Here’s what actually happens. Imagine your 50-salon network. You calculate average engagement:
Total Likes + Comments: 1,250
Total Reach: 125,000 impressions
Average Engagement = 1,250 / 125,000 = 1%
You think: “1% is great vs. Facebook’s 0.15% global.”
But look at the real distribution:
- 5 salons (10%): 3-4% engagement (downtown, active managers)
- 35 salons (70%): 0.7% engagement (normal, they publish regularly)
- 10 salons (20%): 0.05% engagement (never publish or irrelevant content)
Right conclusion? 20% of your locations are out of the game. The average lies.
In franchising, the average deceives you. This is especially true when managing social media across multiple franchise locations. You need to:
- Segment by location type (size, location, manager engagement)
- Track spreads (top 25% vs. bottom 25%), not averages
- Isolate variables (a 2K-follower salon doesn’t play the same game as a 15K-follower one)
That’s why you need 3 distinct KPI levels:
- HQ KPIs: network director, strategic view
- Location KPIs: location manager, tactical view
- Financial KPIs: justify the investment
The 5 HQ piloting KPIs
The network director checks his phone in the morning and sees 5 numbers. That’s it.
KPI #1: Network Publication Rate
Formula:
Publication Rate = (Locations that posted ≥1 time this month) / Total locations × 100
Example: 35 of 50 locations posted at least once in March.
Rate = 35 / 50 = 70%
Threshold:
- <30%: Crisis. Locations aren’t using social.
- 30-50%: Weak. Half are asleep.
- 50-70%: Fair. Habit is forming.
-
70%: Excellent. You’ve broken through the ceiling.
-
85%: Leader. You control the market.
Frequency: Weekly (Monday morning)
Why it matters: I calculated this on my data—going from 15% to 80% publication generates +433% leads in 12 months. Everything else follows. If locations don’t publish, no other metric saves your ROI.
How to measure: Python script on Meta APIs (or manual Excel if <20 locations).
KPI #2: Brand Coherence Score
Formula:
Coherence Score = (Posts conforming to guidelines) / (Total posts audited) × 100

Conformity criteria:
  ✓ Logo/primary colors (#F6BB09 or brand palette)
  ✓ Consistent tone of voice (no mixing formal/casual)
  ✓ Publishing timing (same hour ±30 min if instructed)
  ✓ Content mix ratio (% Educational / Promo / Product / Entertainment)
  ✓ No duplication (same post not 3 consecutive weeks)
Example: Audit of 20 random posts. 17 conform.
Score = 17 / 20 = 85%
Threshold:
- <70%: Fragmented brand. Customers see conflicting messages.
- 70-80%: Acceptable. Some drift tolerated.
-
80%: Good. Brand recognizable.
-
90%: Excellent. Unified brand.
Frequency: Weekly (5 random locations = 20 posts)
Why: A customer sees your downtown location with perfect branding, then sees your suburban location with blurry photos and different colors. Immediate trust loss.
Strong brands (Apple, Nespresso, IKEA) have >95% coherence everywhere. In franchising, 85%+ coherence = 12% more leads per Edelman (2025).
Who audits: Community manager or network communications lead (30 min/week).
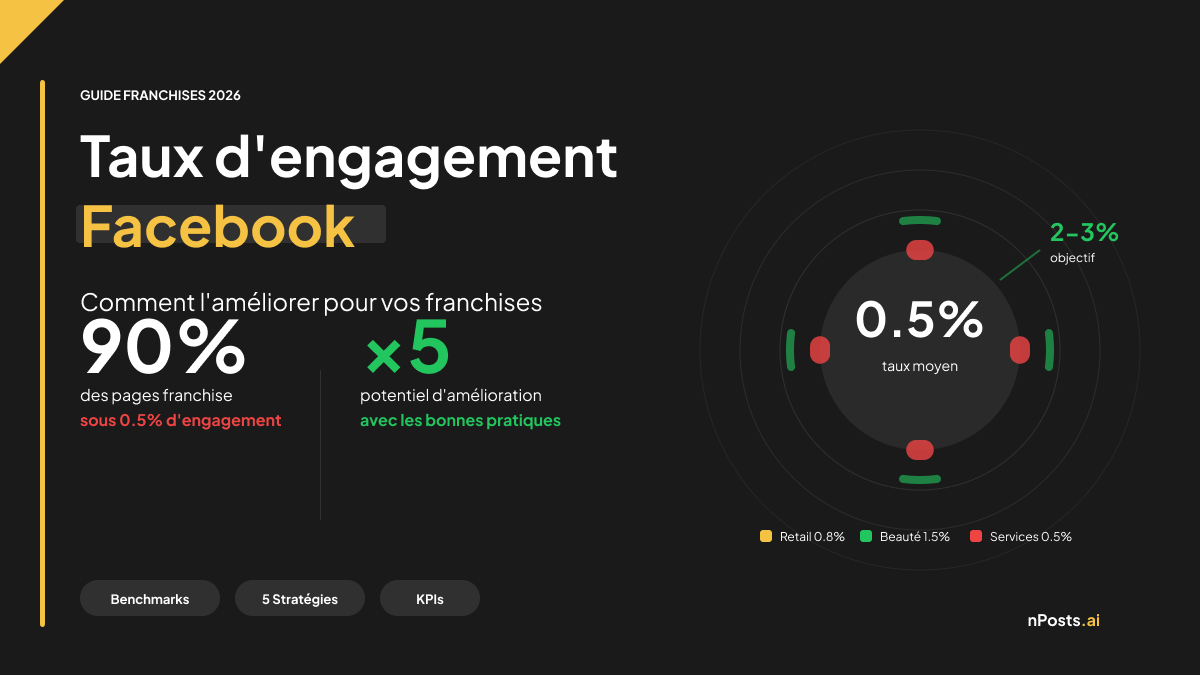
KPI #3: Average Network Engagement
Formula:
Network Engagement = (Likes + Comments + Shares) / Total Reach × 100

Targets by platform:
  Facebook: 0.4-0.6%
  Instagram: 1.2-1.8% (if <50K followers)
  TikTok: 2.5-3.8%
  LinkedIn: 0.8-1.2% (B2B)
50-location network calculation:
- Total likes + comments: 3,200
- Total reach: 400,000 impressions
- Engagement = 3,200 / 400,000 = 0.8% (good for Instagram network)
Threshold by platform and size:
| Platform | <10K Followers | 10-50K | 50K+ |
|---|---|---|---|
| 2.5-3.5% | 1.2-2.0% | 0.6-1.0% | |
| 0.8-1.2% | 0.4-0.8% | 0.2-0.4% | |
| TikTok | 4.0-5.5% | 3.0-4.0% | 1.8-3.0% |
Frequency: Weekly
Why: Engagement shows if content resonates or if you’re shouting into the void. 80% publication rate + 0.2% engagement = disaster. People publish but nobody cares.
Source: Meta Analytics (aggregated via Sprout Social or native).
KPI #4: Local Share of Voice
Formula:
Share of Voice = (Your post impressions) / (Competitor impressions + your impressions) × 100
For a salon in Strasbourg:
- Your 5 posts this month = 4,200 impressions
- Direct competitors (5 rival salons) = 8,600 impressions
- Share of voice = 4,200 / (4,200 + 8,600) × 100 = 33%
Threshold:
- <15%: Losing vs. competition.
- 15-25%: Weak. Visible but not a leader.
- 25-40%: Good. One of the top 3 voices.
-
40%: Local leader.
Frequency: Monthly (Semrush or social listening data)
Why: This is the metric that matters on the ground. A customer searches “salon near me” on Instagram. Who shows up first? You or the competitor? Share of voice explains it.
Source: Semrush, Sprout Social (social listening), or manual LinkedIn/TikTok search.
KPI #5: Leads Generated Via Social
Formula:
Social Leads = (Link clicks) + (Messages received) + (Calls attributed) + (Landing page signups)

Or via GA4:
  Social Leads = (Sessions with utm_source=instagram OR facebook OR tiktok)
                 & (Conversion = form submit OR email capture)
Example: March, 50-location network.
- Link clicks: 147
- Direct messages (conversions): 23
- Calls with “I saw this on Instagram”: 34 (post-call survey)
- Total = 147 + 23 + 34 = 204 leads
Threshold:
- <1 lead per location per month: You’re generating almost nothing.
- 2-4 leads per location per month: Normal.
-
5 leads per location per month: Excellent.
For 50 locations:
- 1 lead/month = 50 leads = weak
- 3-4 leads/month = 150-200 leads = excellent
Frequency: Weekly (GA4) or monthly (survey)
Why it’s crucial: This justifies the budget to the CFO. “We generated 200 leads in March. At 18% conversion = 36 customers. At €180 average order = €6,480 revenue. For €4K budget = 162% ROI.” If you need concrete numbers to plan that budget, see our franchise social media budget allocation guide.
Source: GA4 (UTM tracking) + forms + Facebook pixel.
The 3 location-level KPIs
Each store manager tracks THEIR engagement, not the global network.
KPI #6: Location Engagement Rate (per location)
Formula:
Location Engagement = (Likes + Comments + Shares) / Location followers × 100
Example: Salon in Marseille.
- Tuesday post: 24 likes, 3 comments, 2 shares = 29 interactions
- Location followers: 3,200
- Engagement = 29 / 3,200 = 0.9%
Threshold BY SIZE (for detailed rates by platform and industry, see our 2026 engagement benchmarks):
| Followers | Engagement Target |
|---|---|
| <5K | 2.5-4% |
| 5-20K | 1.2-2.5% |
| 20-50K | 0.8-1.5% |
| >50K | 0.4-0.8% |
Frequency: Bi-weekly (Friday = weekly wrap-up)
Why per location: Comparing engagement on a 2K-follower account to a 15K-follower account is useless. Like comparing a neighborhood bakery to a supermarket by customer count. Different games.
For the manager: “Your engagement is 1.8%, you target 1.5-2.2% for your size. You’re in the zone.”
KPI #7: Local Actions per Month
Formula:
Actions = (Call button clicks) + (Directions clicks) + (Direct messages replied)
          + (Reviews left) + (Landing page visits)
People don’t come in because they liked something. They come in because they clicked “Call,” “Get directions,” or sent a message.
Example: Pharmacy, January.
- Call button clicks (Google Business Profile): 47
- Directions clicks: 23
- Direct Instagram/Facebook messages: 12
- Actions = 47 + 23 + 12 = 82 actions
Threshold:
- <5 actions per month: Location has no local impact.
- 10-20 actions: Normal for small account.
-
30 actions: Excellent.
Frequency: Monthly
Why: Direct action—not “liked,” but “clicked to come to store.”
KPI #8: Follower Growth (net) per Month
Formula:
Growth = (Followers end of month - Followers start of month) / Followers start of month × 100
Example: Salon, 4,000 followers start of March, 4,280 end of March.
Growth = (4,280 - 4,000) / 4,000 = 7%
Threshold:
- <2%: Stagnating or losing followers. Content isn’t engaging.
- 2-5%: Good (normal with tools).
-
8%: Excellent (viral or breakthrough content).
Ignore wild monthly swings. Look at 3-month trends.
Frequency: Monthly
Why: This is account pulse. If followers drop month after month, content isn’t landing.
The 2 financial KPIs to justify investment
These are what the CFO asks for.
KPI #9: Cost Per Interaction
Formula:
CPI = Monthly Ad Budget / Total Interactions

Where Interactions = Clicks + Video views ≥3s + Lead form submissions
Example: 50-location network, €5,000/month Facebook Ads budget.
- Total interactions: 8,200
- CPI = €5,000 / 8,200 = €0.61 per interaction
Threshold:
-
€1 per interaction: Expensive. Revisit audience.
- €0.4-0.8: Normal.
- <€0.3: Excellent, well-targeted audiences.
Frequency: Monthly (Meta Ads Manager calculates auto)
Why: Lower = better ROI. If CPI climbs month over month, signal that audience fatigue (seen too many ads) or targeting drift. For a deep dive on reducing acquisition costs, read our guide on franchise social media cost per lead.
KPI #10: Social ROI per Location
Formula:
Location ROI = (Revenue Attributed - Expenses) / Expenses × 100

Where:
  Revenue Attributed = Social leads × Conversion rate × Avg order value
  Expenses = (Tool per location) + (Ads allocation)
Example: Optical store, 1 location.
-
Social leads (month): 8
-
Conversion rate: 20%
-
Avg order value: €250
-
Revenue = 8 × 20% × €250 = €400
-
Expenses: €150 (nPosts.ai) + €200 (Ads) = €350
-
ROI = (€400 - €350) / €350 × 100 = 14%
Threshold:
- <0%: Losing money.
- 0-50%: Fair but not impressive.
- 50-150%: Good.
-
150%: Excellent.
Frequency: Quarterly (for data smoothing)
Why: This is the CFO number. “This location generates 14% ROI. The others 12%. Network average 68%.”
Template: franchise KPI tracking spreadsheet
Simple template for Google Sheets or Excel.
HQ Level (5 KPIs)
| Week | Publication Rate | Coherence Score | Network Engagement | Local Share of Voice | Social Leads | Status |
|---|---|---|---|---|---|---|
| W1 | 65% | 82% | 0.75% | 28% | 48 | Alert |
| W2 | 72% | 85% | 0.82% | 31% | 52 | OK |
| W3 | 70% | 83% | 0.79% | 29% | 50 | OK |
| Target | >70% | >85% | >0.8% | >30% | >50 |
Location Level (individual for each store)
| Location | Followers | Engagement | Actions/Month | Growth | CPI | ROI |
|---|---|---|---|---|---|---|
| Marseille | 3,800 | 1.8% | 28 | 5.2% | €0.52 | 34% |
| Lyon | 2,200 | 2.4% | 42 | 8.1% | €0.38 | 78% |
| Toulouse | 1,900 | 0.9% | 8 | 2.1% | €0.78 | 12% |
| Bordeaux | 4,100 | 1.2% | 15 | 3.8% | €0.61 | 45% |
Reading: Toulouse in crisis (0.9% engagement, 8 actions, 12% ROI). Investigate: content problem? No Ads budget? Disengaged manager?
Common pitfalls to avoid
Pitfall #1: Comparing engagement between different location sizes
Wrong: “Marseille (3,800 followers) has 1.8% engagement, better than Toulouse (1,900 followers) at 0.9%. Toulouse is weak.”
Right: Toulouse has small account = naturally higher engagement targets. Threshold for Toulouse = 2.5-4%. At 0.9%, it’s below target. Toulouse is weak.
Pitfall #2: Focus on engagement, ignore publication rate
Wrong: “Our locations average 0.8% engagement, that’s good!”
Right: “Publication rate is 45%. To grow leads, first increase publications. Then optimize engagement.”
Cascade: Publication rate = main multiplier. Engagement = optimizer. 15% publication + 2% engagement = zero leads. 80% publication + 0.6% engagement = way more leads.
Pitfall #3: Use network average to judge a location
Wrong: “Network engagement is 0.8%, so each location should hit 0.8%.”
Right: Segment by account size.
Pitfall #4: Calculate ROI on 1 month alone
Wrong: “January -50%, February +280%, average 115%.”
Right: Track ROI over 12-month rolling window. Seasonality exists.
Recommended Tracking Frequency
| KPI | What | Who | Frequency | Time |
|---|---|---|---|---|
| #1 - Publication Rate | Dashboard | Community mgr | Weekly (Monday) | 5 min |
| #2 - Brand Coherence | Audit 20 posts | Community mgr | Weekly (Friday) | 30 min |
| #3 - Network Engagement | Meta Analytics | Community mgr | Weekly | 10 min |
| #4 - Local Share of Voice | Semrush / Listening | Marketing mgr | Monthly | 20 min |
| #5 - Social Leads | GA4 + Notion | Marketing mgr | Weekly | 15 min |
| #6 - Location Engagement | Individual | Each location | Bi-weekly (Friday) | 5 min |
| #7 - Local Actions | Google Business + Meta | Each location | Monthly | 10 min |
| #8 - Follower Growth | Meta | Each location | Monthly | 2 min |
| #9 - CPI | Meta Ads Manager | Ads manager | Monthly | 5 min |
| #10 - Location ROI | Finance calculation | Marketing mgr | Quarterly | 2h |
Total HQ time: 1.5h/week + 2h/quarter.
Automate the measurement
Real victory: don’t calculate this manually every month.
Level 1: Google Sheets Template
Free. You enter data manually.
- Setup time: 2h
- Maintenance: 30 min/week
Level 2: Zapier + Notion
Zapier connects Meta Analytics → Notion DB. Auto-updates.
- Cost: €20/month
- Setup: 4h
- Maintenance: 10 min/week
Level 3: Sprout Social / nPosts.ai Dashboard
Aggregates everything (Facebook, Instagram, TikTok, Google Business). Pre-calculated KPIs. See our franchise social media dashboard guide for a full template with 5 ready-to-use views.
- Cost: €249/month (Sprout) or €59/location (nPosts.ai)
- Setup: 1h
- Maintenance: 5 min/day
My recommendation:
- <10 locations: Sheets
- 10-50 locations: Zapier
-
50 locations: Professional dashboard
FAQ
Q: How to combine qualitative KPI (coherence) and quantitative (engagement)?
A: Simple scorecard:
KPI Score = (Coherence % / 100) × 40% + (Engagement achieved / Target) × 40% + (Leads / Target) × 20%

Example location:
  Coherence 85% → 0.85 × 0.40 = 0.34
  Engagement 1.8 / target 1.5 → 1.2 × 0.40 = 0.48
  Leads 12 / target 8 → 1.5 × 0.20 = 0.30
  Total = 1.12 = A+ (>1.0 = excellent)
Simple to explain, easy to calculate.
Q: What about negative comments?
A: Track separately from KPI score. Add column “Negative comments / Month.”
Threshold:
- <2 negative comments / 100 interactions = normal
-
5 = signal of a real problem
Example: Location A has 85% coherence, 1.8% engagement, but 12 negative comments in March. Needs investigation.
Q: Engagement targets by vertical?
A:
| Vertical | Engagement Target | Reason |
|---|---|---|
| Hair / Beauty | 2.0-3.2% | Before/after highly engaging |
| Fitness | 2.5-4.0% | Visual transformation |
| Food / Restaurant | 1.8-2.8% | Food porn very likable |
| Optical / Audio | 0.8-1.5% | Less visual, more product-focused |
| Real Estate | 0.6-1.2% | Long sales cycle, little micro-engagement |
Adjust your thresholds by vertical. An eye doctor at 0.8% = excellent. A salon at 0.8% = weak.
Q: When to escalate a underperforming location?
A: The 3-month rule.
If a location has publication rate <50% OR engagement <50% of target OR <2 actions/month for 3 consecutive months = escalate (network manager calls the location manager).
Reason: one bad week is normal. 3 months = pattern.
Summary: The 10 KPIs in structure
HQ (Network Director)
├─ KPI #1  : Network Publication Rate          Weekly
├─ KPI #2  : Brand Coherence Score            Weekly
├─ KPI #3  : Network Engagement               Weekly
├─ KPI #4  : Local Share of Voice             Monthly
└─ KPI #5  : Social Leads Generated           Weekly

LOCATION (Location Manager)
├─ KPI #6  : Location Engagement              Bi-weekly
├─ KPI #7  : Local Actions                    Monthly
└─ KPI #8  : Follower Growth                  Monthly

FINANCE (CFO)
├─ KPI #9  : Cost Per Interaction             Monthly
└─ KPI #10 : Location ROI                     Quarterly
Each person sees their 3-5 KPIs, ignores the noise. That’s the key.
Next steps
You now know:
- The 10 KPIs that matter in franchising
- Thresholds by account size and vertical
- Optimal tracking frequency
- How to spot problems vs. noise
Next step: choose 3 KPIs to implement this month (ex. publication rate + engagement + leads), then add 2 more next month.
You can also read the complete franchise social media ROI guide to see how these KPIs translate to revenue and measurable ROI.
To truly automate measurement and save 4-5 hours/week of reporting, request an nPosts.ai demo—the dashboard centralizes all these KPIs for 50+ locations in 1 click.
Sources
- Hootsuite, Social Media Benchmarks 2025
- Sprout Social, Engagement Rate Study Q1 2026
- Edelman, Brand Coherence Impact 2025
- Meta Investor Relations, Ad Performance Metrics 2026
- Semrush, Local Social Intelligence 2026
- Google Analytics 4 Official Documentation