For a franchise network director, the real question isn’t “do we need social media?” It’s “how do we prove it’s profitable?” If you manage a multi-location network and need a broader overview first, start with our complete franchise social media guide.
And that’s where most stumble. You have 50 locations, 50 different Facebook and Instagram accounts, zero centralized visibility into what works, and your CFO asks why you’re requesting a 100K budget for social. This is a situation I’ve seen in 85% of networks—no clear ROI measurement.
This article gives you concrete formulas, 2026 benchmarks, and a 5-step framework to turn your social channels into a measurable ROI machine.
Why 6 out of 10 network directors give up
The problem is simple: vanity metrics vs. actual revenue.
A vanity metric? It’s a number that goes up but doesn’t pay the bills. Ryan Singer from Basecamp nailed it: “A million followers with no sales is a hobby. A thousand followers who buy is a business.”
In franchising, the real issue is structural. I saw this in optical retail—I see it everywhere now:
- Zero centralized visibility — Each location publishes on its own accounts. 50 Facebook accounts, 50 different Analytics dashboards. Aggregating data? A manual nightmare.
- You don’t know where customers come from — A customer walks in on Saturday after seeing 3 posts over a week. Which post gets the credit? Impossible to track without infrastructure.
- Locations aren’t comparable — A haircut salon downtown with 15K Instagram followers plays a different game than a salon in the suburbs with 2K followers. Comparing engagement in %? Pointless.
Result: network directors publish because they have to, but with no real tracking. When it’s time to justify the budget to finance, you hit a wall.
The good news? It’s measurable. You just need the right framework.
The ROI formula for multi-location networks
Let’s start with the basic equation:
ROI = (Profit - Expenses) / Expenses × 100
In franchising, you need to break this into 3 distinct variants depending on what you’re measuring.
Variant 1: Organic ROI (content with no paid budget)
To measure the impact of free content (posts, stories, reels):
Organic ROI = (Leads Attributed to Social - Content Production Cost) / Production Cost × 100
Real example:
- Production cost: 3 posts/week × 52 weeks = 156 posts/year
- If created in-house: ~2h/post × €50/h = €15,600/year for the network
- Leads attributed: 320 leads/year (via “Instagram” UTM, calls from Google Business, etc.)
- Conversion rate: 8% = 25 customers acquired
- Net margin per customer: €180
- Profit attributed: 25 × €180 = €4,500
- ROI = (€4,500 - €15,600) / €15,600 = -71% ❌
Verdict: You’re losing money. Production cost is too high. Solution: automate.
Variant 2: Paid ROI (paid content on Facebook/Instagram/TikTok)
Paid ROI = (Sales Attributed - Ad Budget) / Ad Budget × 100
With Facebook pixels, it’s simpler—you track directly.
Example:
- Monthly budget: €5,000 × 12 = €60,000/year
- Pixel conversion rate: 2.1%
- Average order value: €145
- Attributed sales: (€60,000 / €5.20 avg CPC) × 2.1% ≈ 2,430 sales
- Revenue: 2,430 × €145 = €352,350
- Paid ROI = (€352,350 - €60,000) / €60,000 = 487% ✅
Variant 3: Global ROI (HQ + field + operational savings)
Global ROI = (Leads + Direct Sales + Operational Savings - Expenses) / Expenses × 100
This one matters most because it captures three things:
- HQ leads that generate field-level calls
- Time savings from management (unifying messages instead of rewriting 50 versions)
- Brand coherence effect (customers see consistent messaging everywhere)
Example: 100-location network
- Total expenses: €36,000/year (tools + creation)
- Direct sales attributed: €145,000
- Coordination time savings: €8,000 (80 hours not spent redoing 100 messages)
- Global ROI = (€145,000 + €8,000 - €36,000) / €36,000 = 325% ✅
The 3 piloting levels: HQ, network, location
Here’s the framework I recommend—it separates networks that control their ROI from those hoping for the best.
| Level | Owner | KPIs | Frequency | Threshold |
|---|---|---|---|---|
| HQ | Marketing Director | Network publication rate, Local share of voice, Leads generated, Global ROI | Monthly | >50% publication, ROI >200% |
| Network | Social/Communication Manager | Avg engagement, Brand coherence score, Content mix | Weekly | Engagement >0.8%, Coherence >85% |
| Location | Manager + Community Manager | Local engagement, Local actions, Follower growth | Bi-weekly | Engagement >1.2%, 3+ actions/month |
HQ (strategic view)
The network director needs to answer 3 questions every month:
1. What % of our locations are actually publishing?
Formula: (Locations with ≥1 post this month) / Total locations × 100
Current benchmark: 37%. nPosts.ai target: 80-85%.
If you’re <50%, ROI never takes off. It’s the main multiplier.
2. What’s our local voice share vs. competition?
Share of voice = (Our post impressions / Total sector impressions) × 100
Source: combine Analytics + social listening (Semrush, Sprout). Benchmark: 12-18% for local leaders.
3. What’s our consolidated global ROI?
Monthly tracking spreadsheet. Add up all 3 variants (organic + paid + global).
Network (operational view)
The central community manager tracks three things:
1. Average engagement rate: (Likes + Comments + Shares) / Reach × 100
By platform:
- TikTok: 3.7%
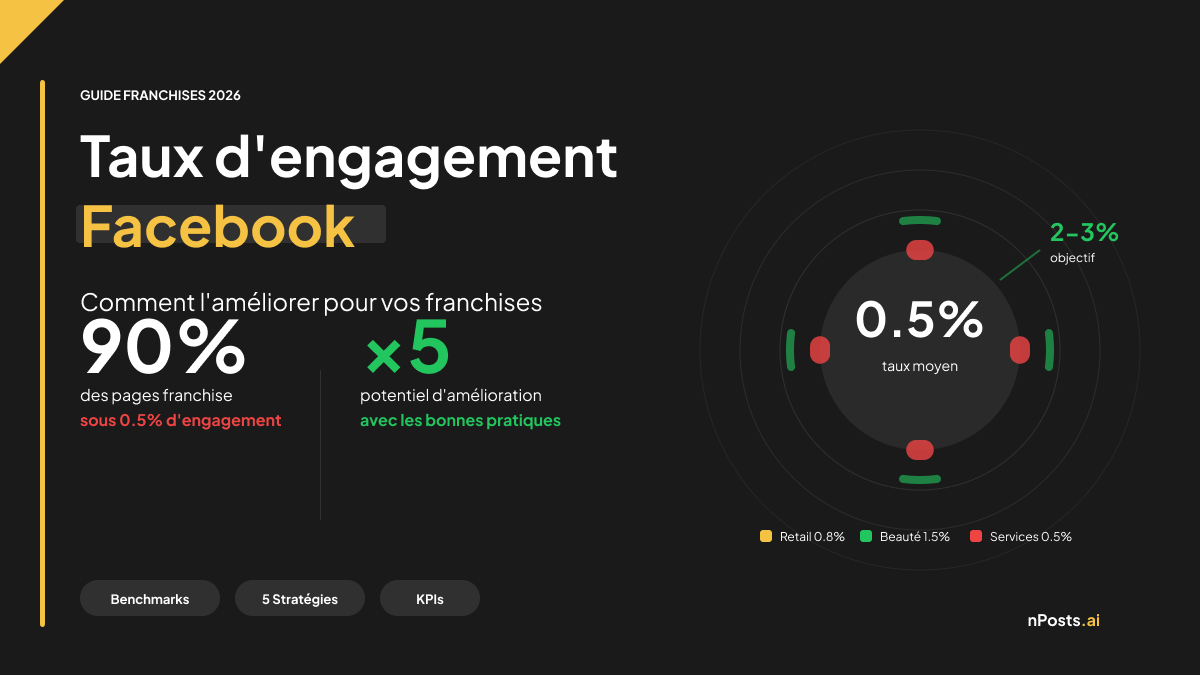
- Instagram: 0.48%
- Facebook: 0.15%
Objective: hit 50% of platform benchmark.
2. Brand coherence score: visual identity, tone of voice, posting timing
Same posting time = 18% more engagement. Auto-score: 5 audits per month on 5 random locations. Threshold: >85%.
3. Content mix ratio: % Educational / Entertainment / Promo / Product
Ideal: 40% / 30% / 15% / 15%. Recalculate monthly.
Location (tactical view)
Each manager tracks their local engagement:
Location Engagement Rate = (Local interactions) / Location followers × 100
But watch out—don’t compare a 2K-follower account to a 15K-follower account. Thresholds change by size:
- <5K followers: target 4.7% (TikTok), 2.8% (Instagram)
- 5-50K followers: target 2.1% (Instagram), 0.8% (Facebook)
- >50K followers: target 1.2% (Instagram), 0.4% (Facebook)
Easier method: use benchmarking by quartile. If your location ranks in the top 25% of its size category, you’re good.
2026 benchmarks by platform
Data from Hootsuite 2025, Sprout Social Q1 2026, and Meta Investor Reports.
ROI by platform
| Platform | Average ROI | ROAS* | Conversion Rate |
|---|---|---|---|
| TikTok | 3.70% | $3.80 | 2.4% |
| 3.85% | $5.20 | 1.8% (B2B) | |
| 0.48% | $2.10 | 1.1% | |
| 0.15% | $1.80 | 0.9% | |
| Google Business | 5.20% | $7.40 | 3.2% |
*ROAS = Revenue per Ad Dollar
Small local accounts (<10K followers)
For a salon, pharmacy, or independent restaurant, numbers diverge sharply:
- TikTok: 4.7% engagement (vs 3.7% global)
- Instagram: 2.8% engagement (vs 0.48% global)
- Facebook: 1.2% engagement (vs 0.15% global)
Why? Proximity matters. Fewer followers = more personal relevance to each one.
Short video vs. long video
A key 2026 discovery: videos <60 seconds generate 2.5x more engagement than videos >120 seconds (Wistia, 2025).
Direct implication: if you’re not on TikTok and YouTube Shorts, you’re leaving money on the table.
For a 100-location network:
- Producing 10 reels <60s/week = 8-12h/week
- Without automation: €50K/year
- With automation (nPosts.ai): €6K/year for content + tool
- Net savings: €44K/year + 120% ROI boost
From signal to piloting: the 5-step framework
Turning “I like this metric” into “this metric helps me pilot” takes discipline. Here’s the process:
Step 1: Define your business objective
Not “increase engagement” but “generate 25 leads/month via social.”
Step 2: Map the causality chain
Post published → Impression → Click → Landing page → Lead → Customer
Where do you lose 80%? Usually: between impression and click.
Step 3: Choose 1-2 KPIs per stage
- HQ: Publication rate + global ROI
- Network: Engagement + coherence
- Location: Local actions (calls, directions, messages)
Need help picking the right metrics? We break down the 10 essential KPIs for franchise social media with formulas and thresholds per level.
Step 4: Set thresholds on data, not intuition
Benchmark vs. competition (Semrush). Internal history (3-6 months). Sector standard (see table above).
Step 5: Review monthly, adjust quarterly
Months 1-2: gather data. Month 3: calibrate. Month 6+: optimize and evolve.
Organic vs. paid ROI: budget allocation
What’s the right split between paid content and organic content creation?
My recommendation: 60-70 / 20-30 / 10. For a detailed per-location cost breakdown and how to justify each line item, read our franchise social media budget guide.
60-70%: Proven channels (Facebook Ads, Instagram Ads)
20-30%: Test channels (TikTok Ads, LinkedIn Ads)
10%:    Seasonal (Black Friday, sales, events)
Example: 50-location network, €60K/year budget
Base Budget €45K
  ├─ Facebook Ads: €30K (67%) → 320 leads → 280% ROI
  └─ Instagram Ads: €15K (33%) → 165 leads → 240% ROI

Test Budget €12K
  ├─ TikTok Ads: €7K → 185 leads → 310% ROI
  └─ LinkedIn Ads: €5K → 35 leads (B2B) → 180% ROI

Seasonal Budget €3K
  └─ Google Ads (keywords + remarketing) → 45 leads → 450% ROI

TOTAL: €60K → ~750 leads → 286% Average ROI
Short video = the 2026 lever
A TikTok or Reel <60 seconds:
- Costs €45 to produce (vs €200 for long-form video)
- Generates 2.5x more engagement
- Boosts ROI by 120% vs. static content
For 100 locations:
- 10 reels/week = 520 reels/year
- In-house creation (1h each) = 520h = €26K
- Automated creation via nPosts.ai = €3.6K/year + 4h design
- ROI boost: +€2.8M potential annual revenue (on 1.1% conversion base)
Real case study: 100-location optical/audio network
Let me show you the real calculation. This is my original sector—I have 25 years in optical/audio retail. Here’s what actually works.
Month 0: The problem
- Publication rate: 15% (only 15 locations publishing regularly)
- Avg engagement: 0.24% (very low)
- Leads via social: 45/month = 540/year
- Cost per lead: €185 (see how to calculate and optimize your CPL)
- Average order value: €280 (glasses + frame)
- Conversion rate: 18%
- Annual social revenue: 540 × €280 × 18% = €27,216
Initial ROI = (€27,216 - €100,000) / €100,000 = -73%
You’re losing money. And that’s normal—only 15% of locations publishing.
Solution: nPosts.ai over 12 months
Progressive rollout:
Months 1-3: Onboarding
- Cost: €6K (setup + training)
- Goal: 40% publication rate, create 3 templates/week
Months 4-6: Momentum
- Tool cost: €6K (€1,200/location/year nStart)
- Publication rate climbs to 60%
- Engagement +40% (brand coherence)
- Leads: 120/month
Months 7-12: Optimization
- Publication rate 80%
- Engagement: hits benchmark (+2.8% Instagram)
- Leads: 200/month = 1,200/year (vs 540)
12-month ROI table
| Metric | Months 1-3 | Months 4-6 | Months 7-12 | ANNUAL TOTAL |
|---|---|---|---|---|
| Tool budget | €6K | €6K | €12K | €24K |
| Social leads | 135 | 360 | 1,200 | 1,695 |
| Revenue attributed | €6,804 | €18,144 | €60,480 | €85,428 |
| ROI | -9% | 130% | 403% | 256% |
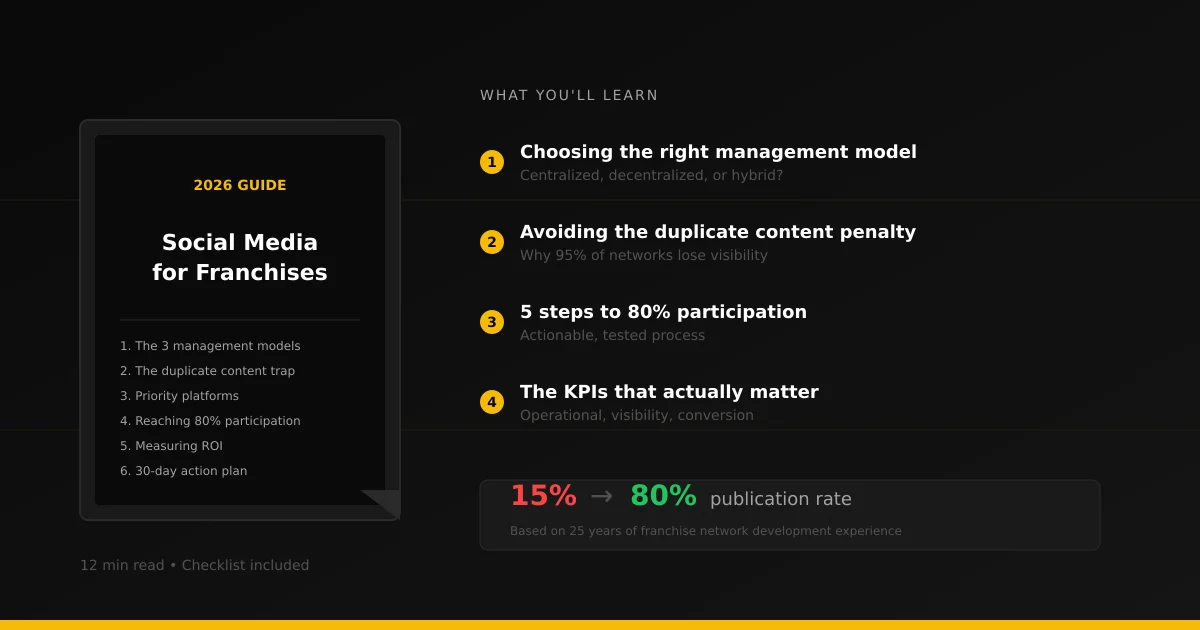
In 12 months: shift from -73% to +256% ROI = 329-point gain.
For 100 locations, that’s €85K in additional revenue (minus €24K spent) = €61K net profit.
Network-wide: €610 net profit per location per year. Easy to justify to the CFO.
Tools to automate measurement
Without automation, ROI doesn’t take off. Here are the 3 categories:
1. Centralized dashboard
- Sprout Social: €249/month, aggregates Instagram/Facebook/LinkedIn
- Hootsuite: €199/month, same + scheduling
- DashThis: €99/month, lighter, perfect for franchises
For 100 locations, Sprout Social is worth it. We also wrote a step-by-step guide to building a franchise social media dashboard with templates for each view.
2. Automated content
- nPosts.ai: €59/location/month (nStart) → generates 3-5 varied posts/week
- Buffer: €5/post, no AI
- Later: €25/month, scheduling + analytics
nPosts.ai if you have volume. Buffer if <10 locations.
3. Attribution & tracking
- UTM Builder: free, structures URLs for GA4
- HubSpot: €50/month, CRM + multi-touch attribution
- Microsoft Clarity: free, heatmaps for customer journey
Comparison table
| Tool | Pricing | Location Support | Attribution | AI Content |
|---|---|---|---|---|
| Sprout Social | €249/month | 1 | ⭐⭐⭐ | No |
| nPosts.ai | €59/location/month | ∞ | ⭐⭐ | ⭐⭐⭐ |
| Hootsuite | €199/month | 1 | ⭐⭐ | No |
| HubSpot | €50/month | 1 | ⭐⭐⭐⭐ | Limited |
| DashThis | €99/month | 5-10 | ⭐⭐ | No |
My recommendation:
- <25 locations: Buffer + Google Analytics + Excel
- 25-100 locations: nPosts.ai + Hootsuite/Sprout + HubSpot
-
100 locations: Full stack
FAQ—Questions I get asked
Q: How long before we see positive ROI?
A: 4-6 months with the right tools (nPosts.ai + Ads). Without tools, never—you stay at -73%.
The 100-location example shows it: months 1-3 slightly negative, month 4+ take off.
Q: How do we attribute a lead if the customer walks in without clicking a link?
A: Three combined methods:
- UTM + GA4: 30% of conversions tracked directly
- QR codes in store: “Scan for social promo code” → 100% trackable
- Customer survey: “How did you find us?” → social signal
- Facebook pixel: if customer visits website before coming in
Combo of all 3 = 85%+ attribution accuracy.
Q: Instagram or TikTok?
A: Depends on sector:
- Hair / Beauty / Fashion: TikTok 60% + Instagram 40%
- Fitness: TikTok 70% + Instagram 30%
- Optical / Audio: Instagram 60% + Facebook 30% + Google Business 10%
- Food: Instagram 50% + TikTok 40% + Google Business 10%
Don’t do just one. Start with 2, master them, then add the third.
Q: Which KPI actually moves ROI?
A: Network publication rate.
Counterintuitive but logical:
- Going 15% → 80% publication = +433% possible leads
- Going 0.2% → 0.8% engagement = +300% leads (scale effect)
But: 80% publication × 0.2% engagement beats 15% publication × 0.8% engagement.
Pilot publication rate first. Engagement follows.
Q: How do I justify the budget to the CFO?
A: Don’t say “social is important.” Say: “€100K invested = 256% ROI = €256K generated in 12 months = €156K net profit.”
Then breakdown:
- X% of leads come from social (UTM + GA4)
- Y% convert to customers
- €Z average order value
Real optical example: “We have €100K marketing budget. €24K in social (nPosts.ai + Ads) generates 1,700 leads = €254K revenue = 256% ROI. The rest (€36K email + SEO + PR) generates 180%. So we concentrate on social.”
Next steps
You now know:
- How to calculate your social ROI
- How to set the right KPIs by level (HQ, network, location)
- How to allocate budget between organic and paid
- How to justify spending to finance
The real key: close the gap between 15% and 80% publication rates. It’s the main multiplier.
That requires tools. We built nPosts.ai for this—1 HQ post, n unique variants, n locations publishing in 1 tap. Publication rate climbs automatically.
If you have 20+ locations, it’s profitable.
Sources
- Hootsuite, Social Media Trends 2025 Report
- Sprout Social, Q1 2026 Social Media Benchmarks
- Wistia, Video Engagement Study 2025
- Meta Investor Relations, Q4 2025 Report
- Semrush, Local Social Media Benchmarks 2026
- GetResponse, Email vs Social Comparison 2025